Gallery Showcase
Some of my latest visualizations
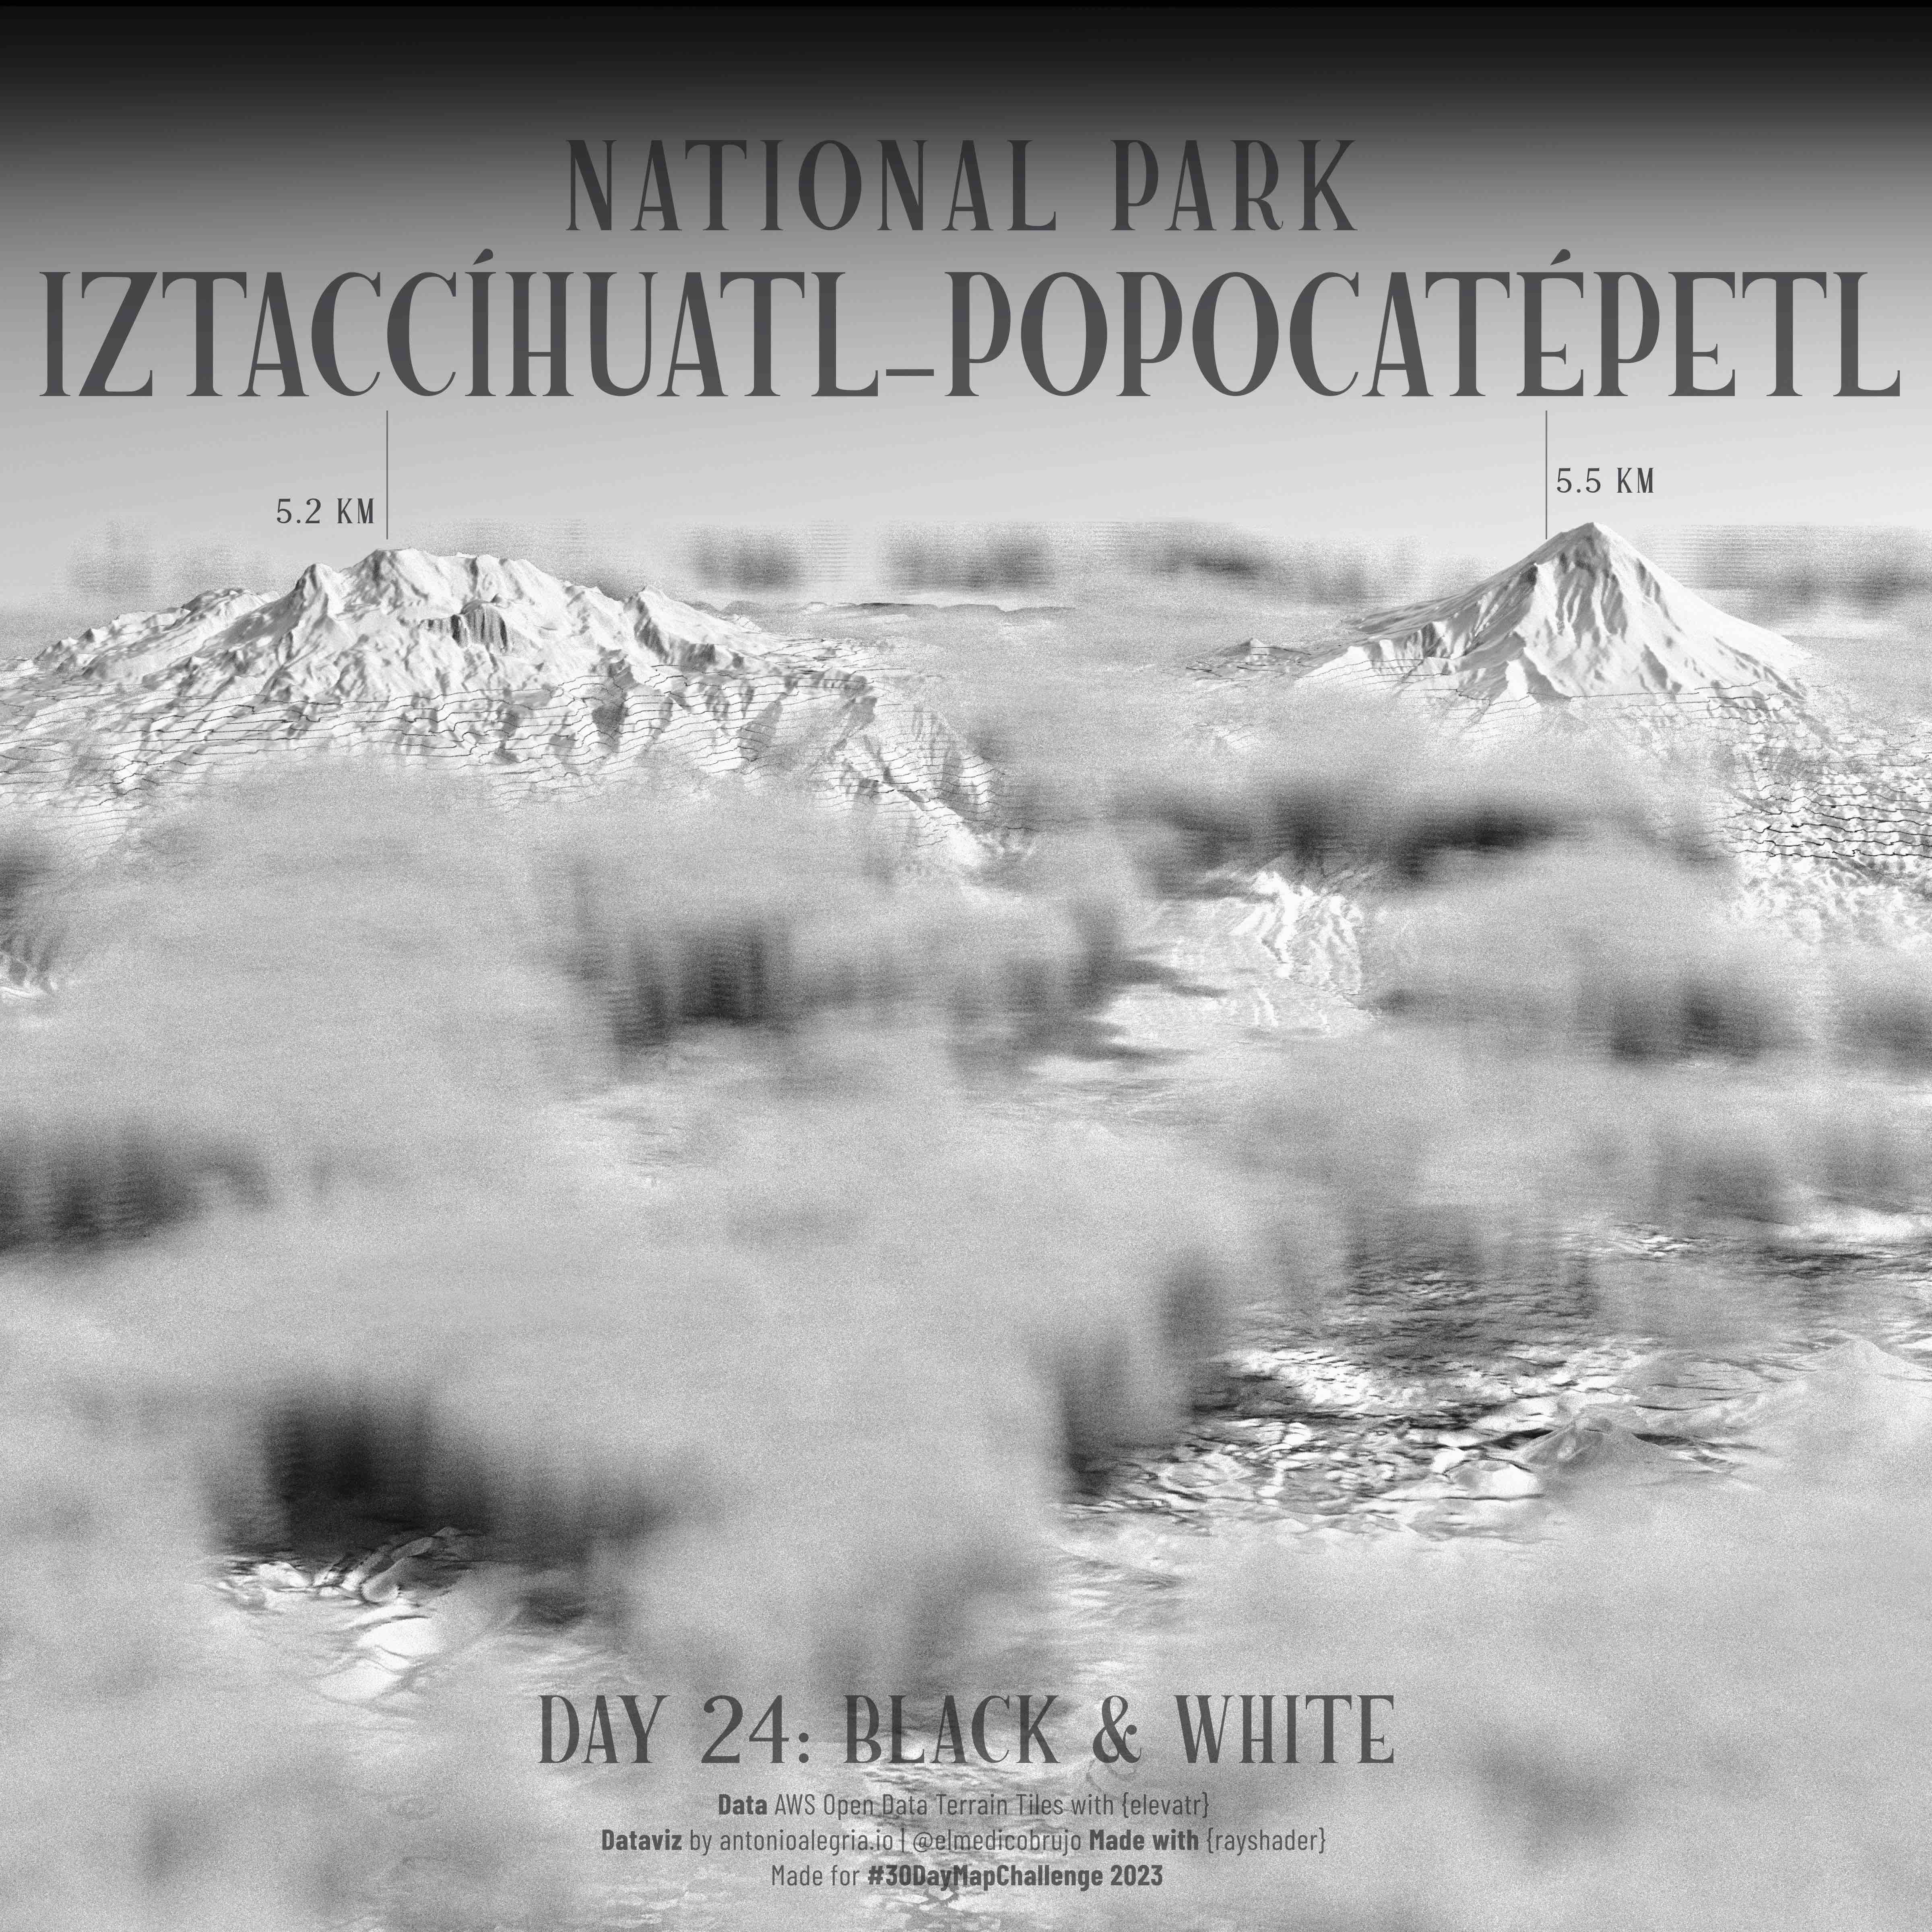
National Park Iztaccíhuatl-Popocatépetl
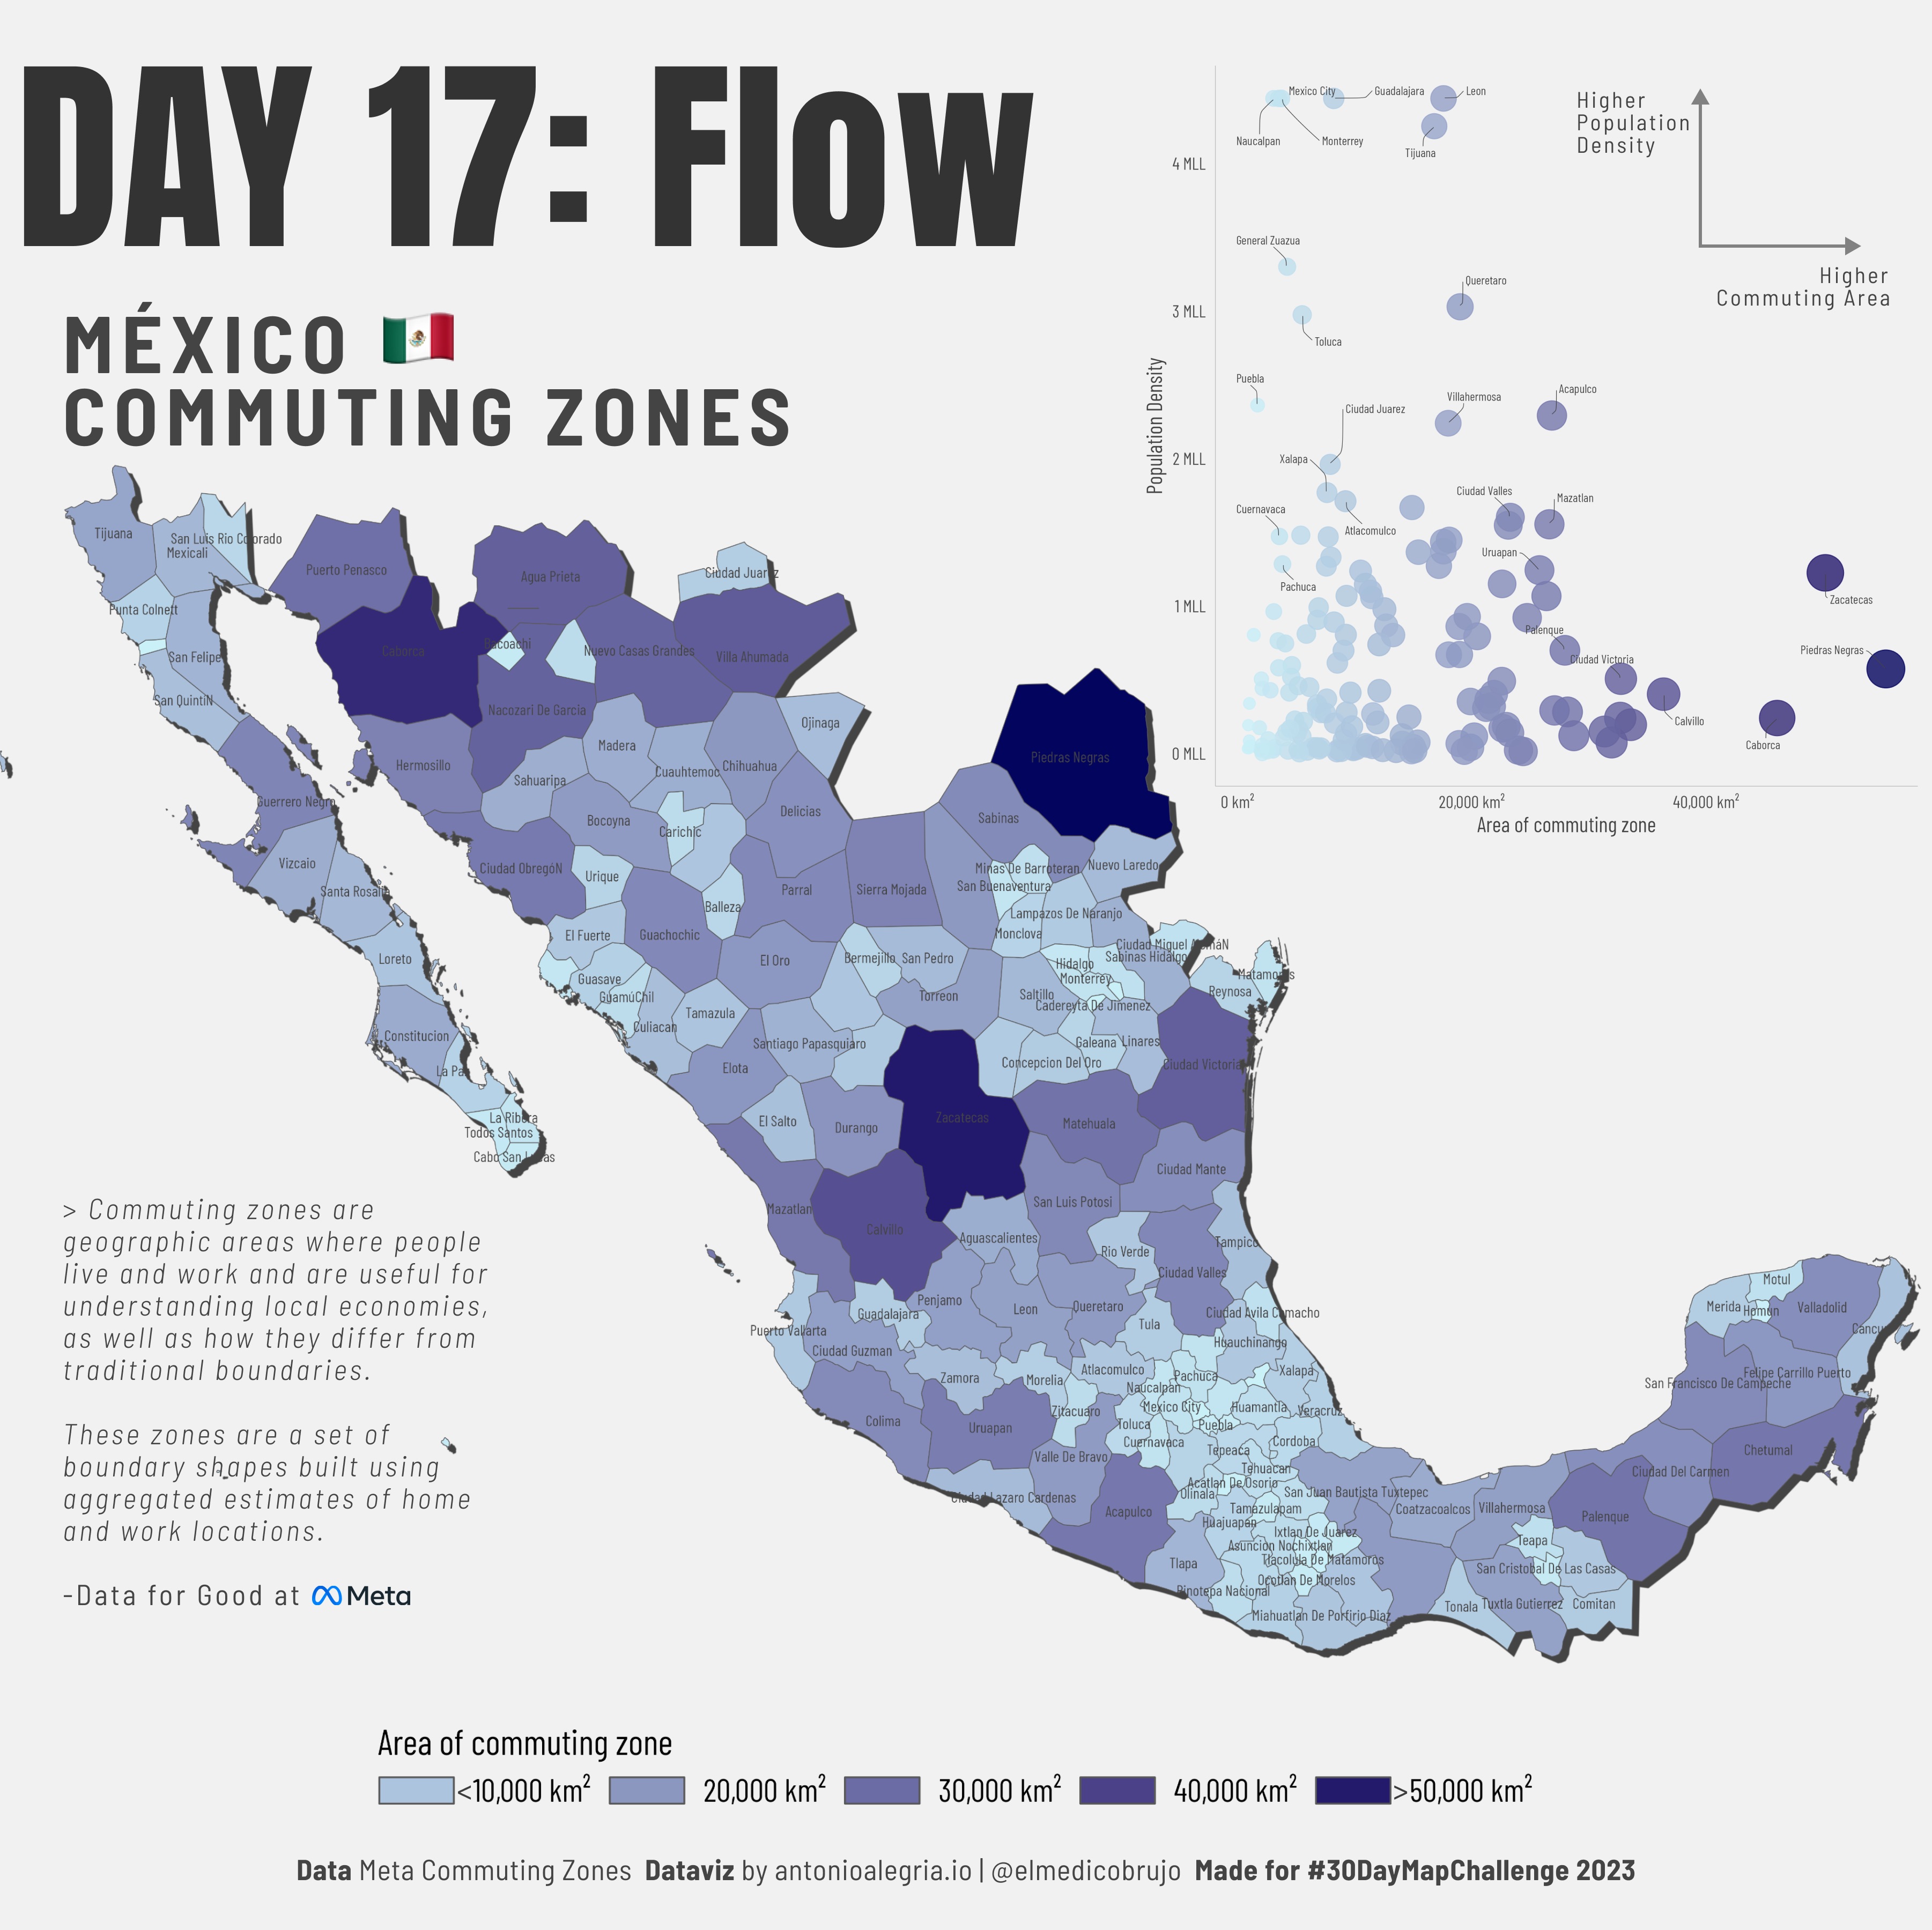
México Commuting Zones.
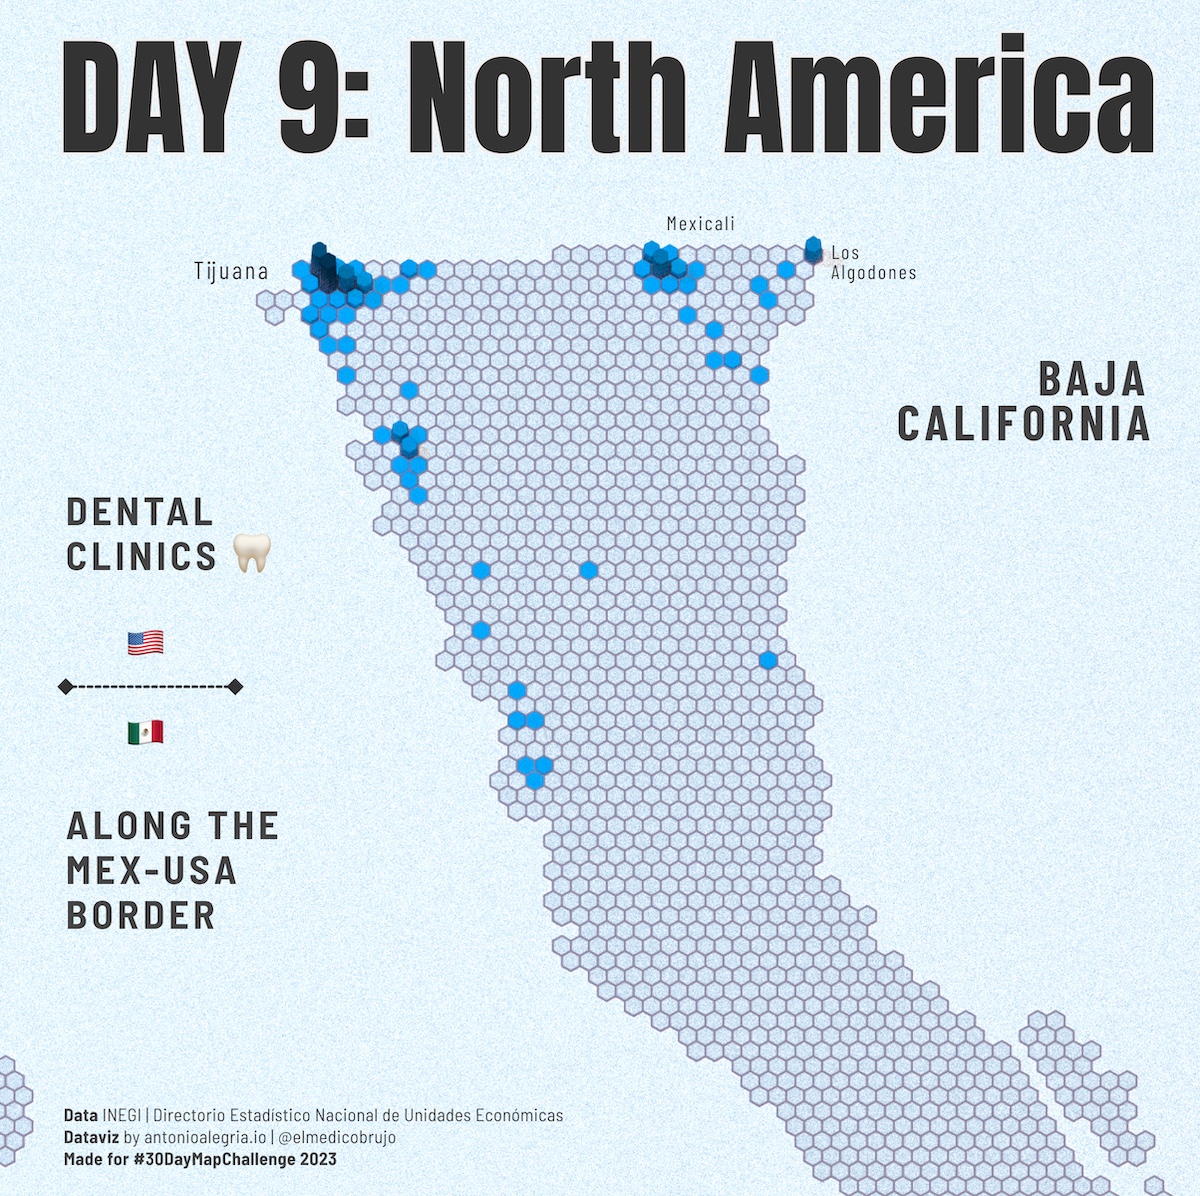
Baja California: Dental Clinics Along The Border
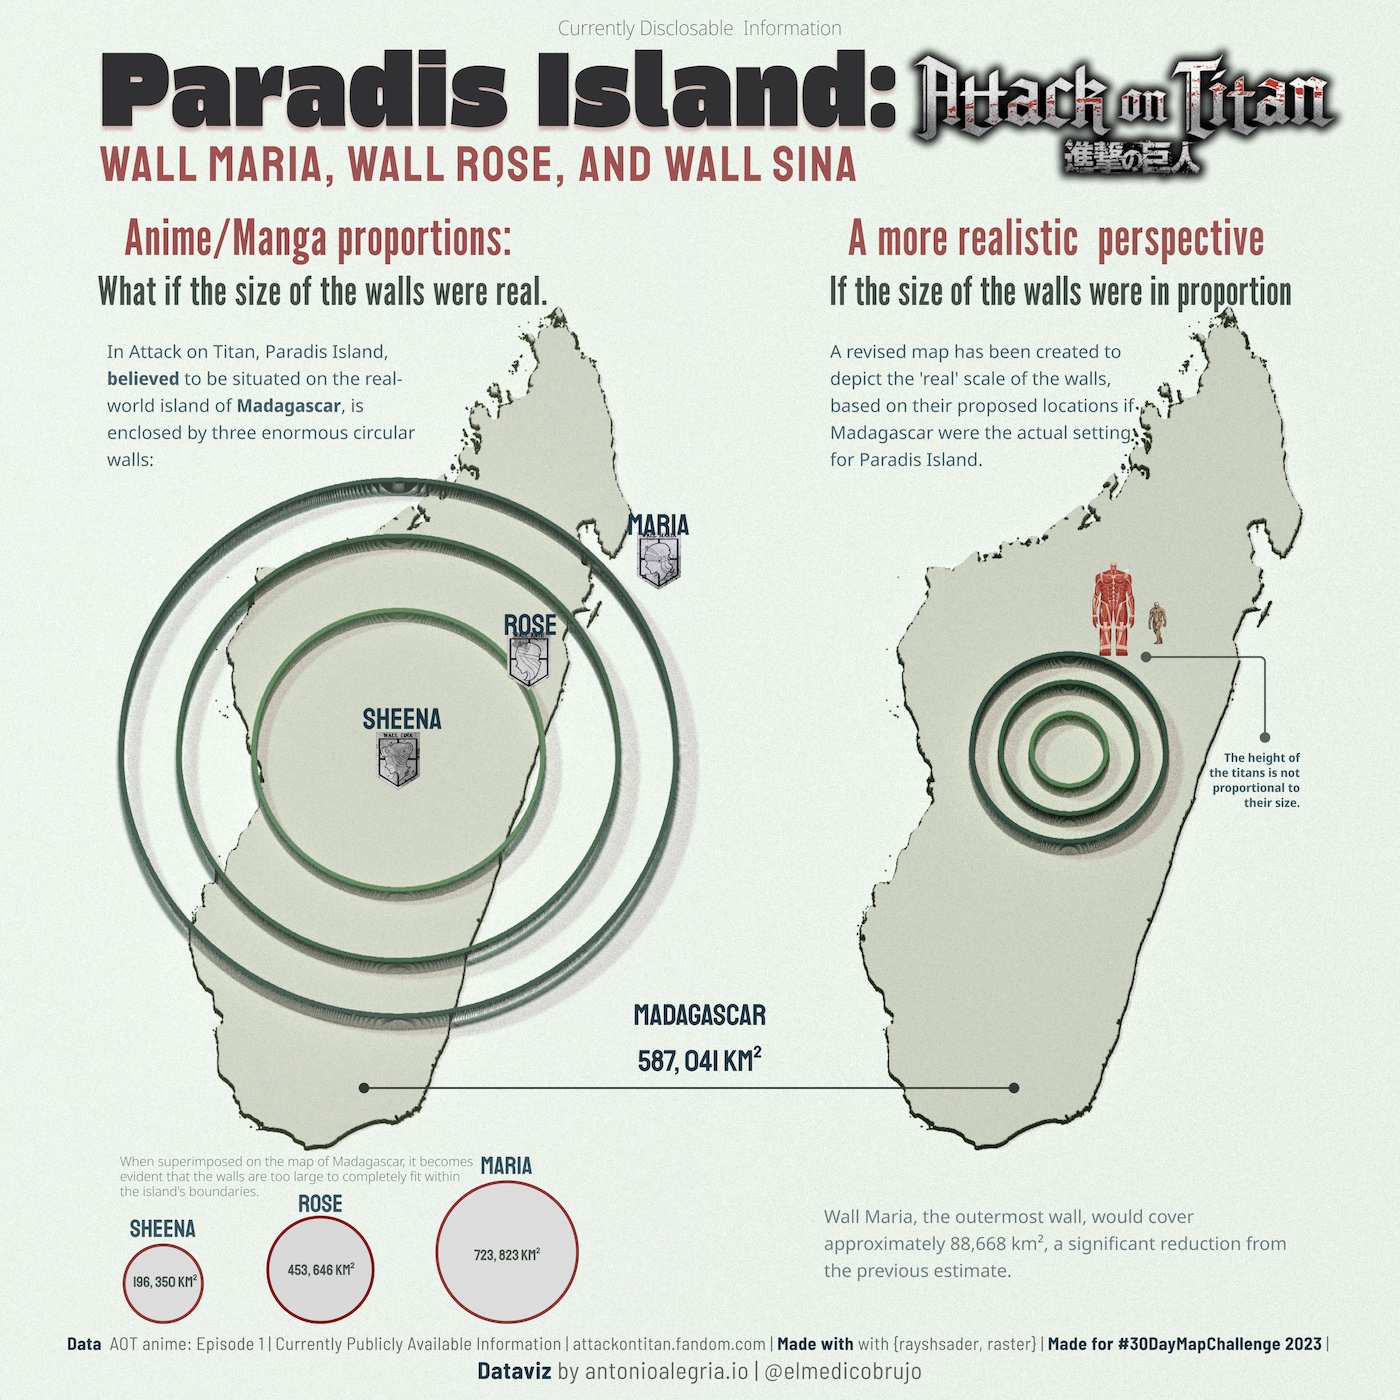
Attack on titan: What if Paradis Island Were Real?
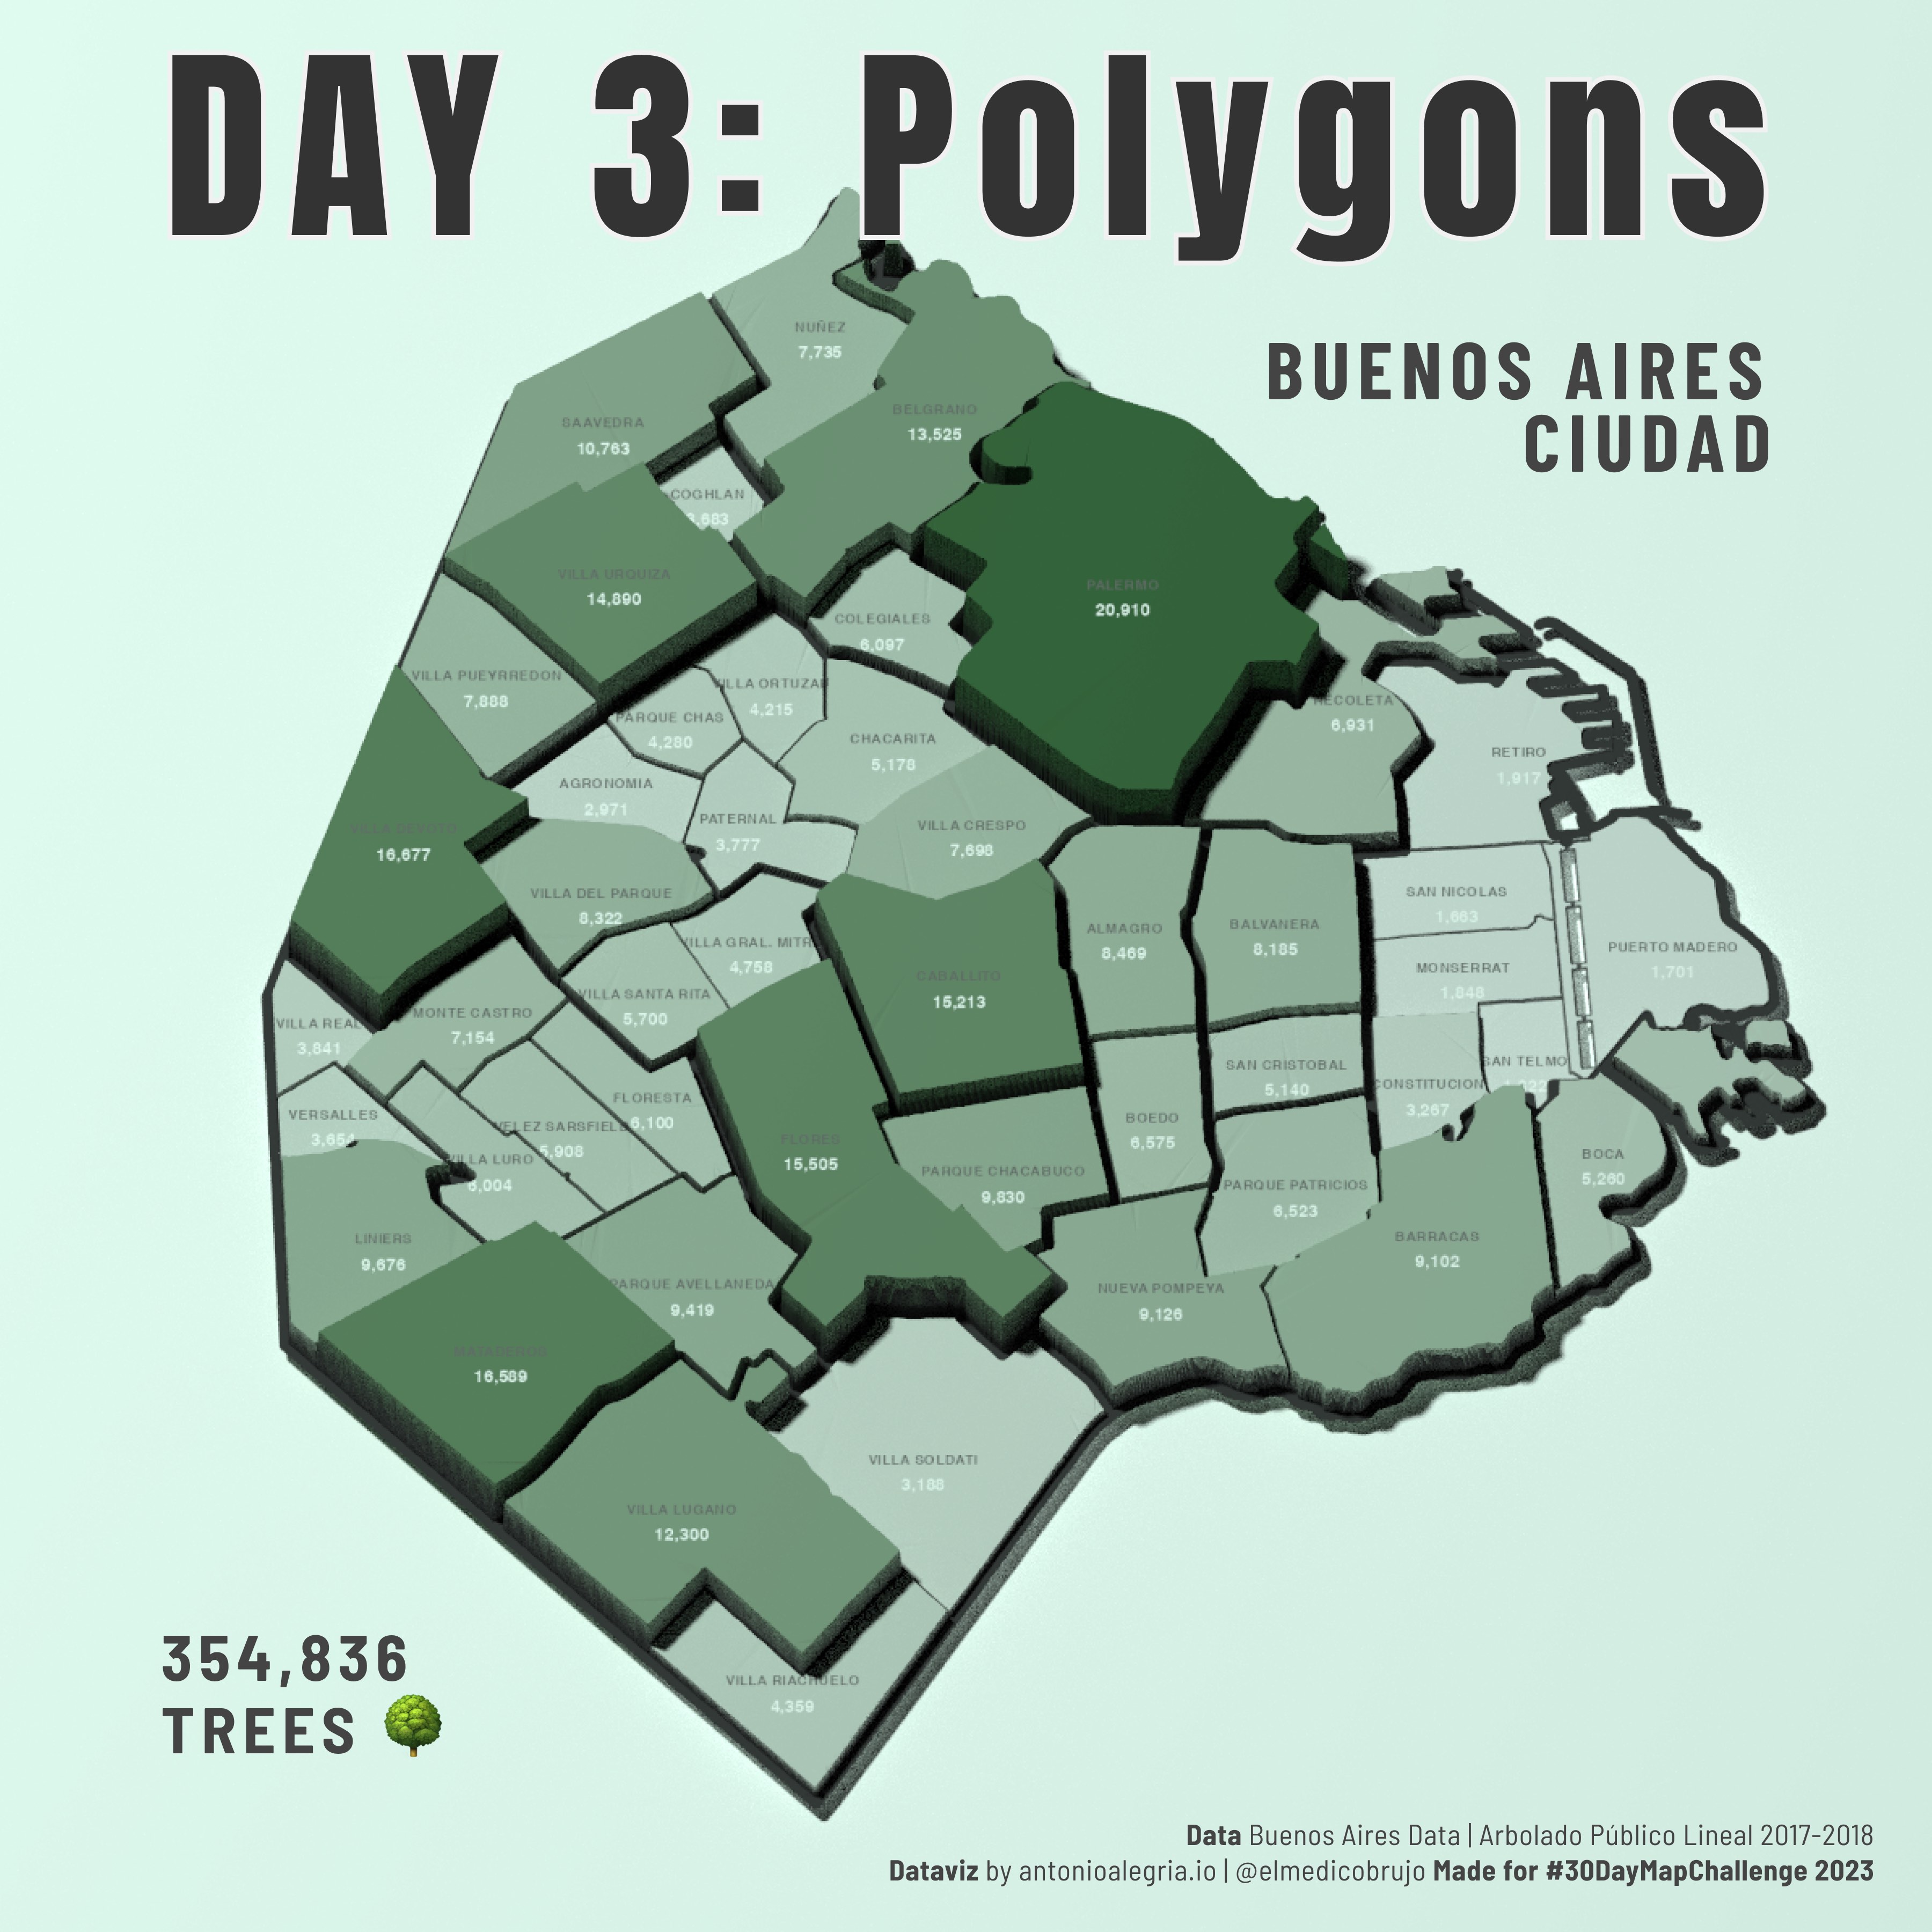
Trees in Buenos Aires Ciudad
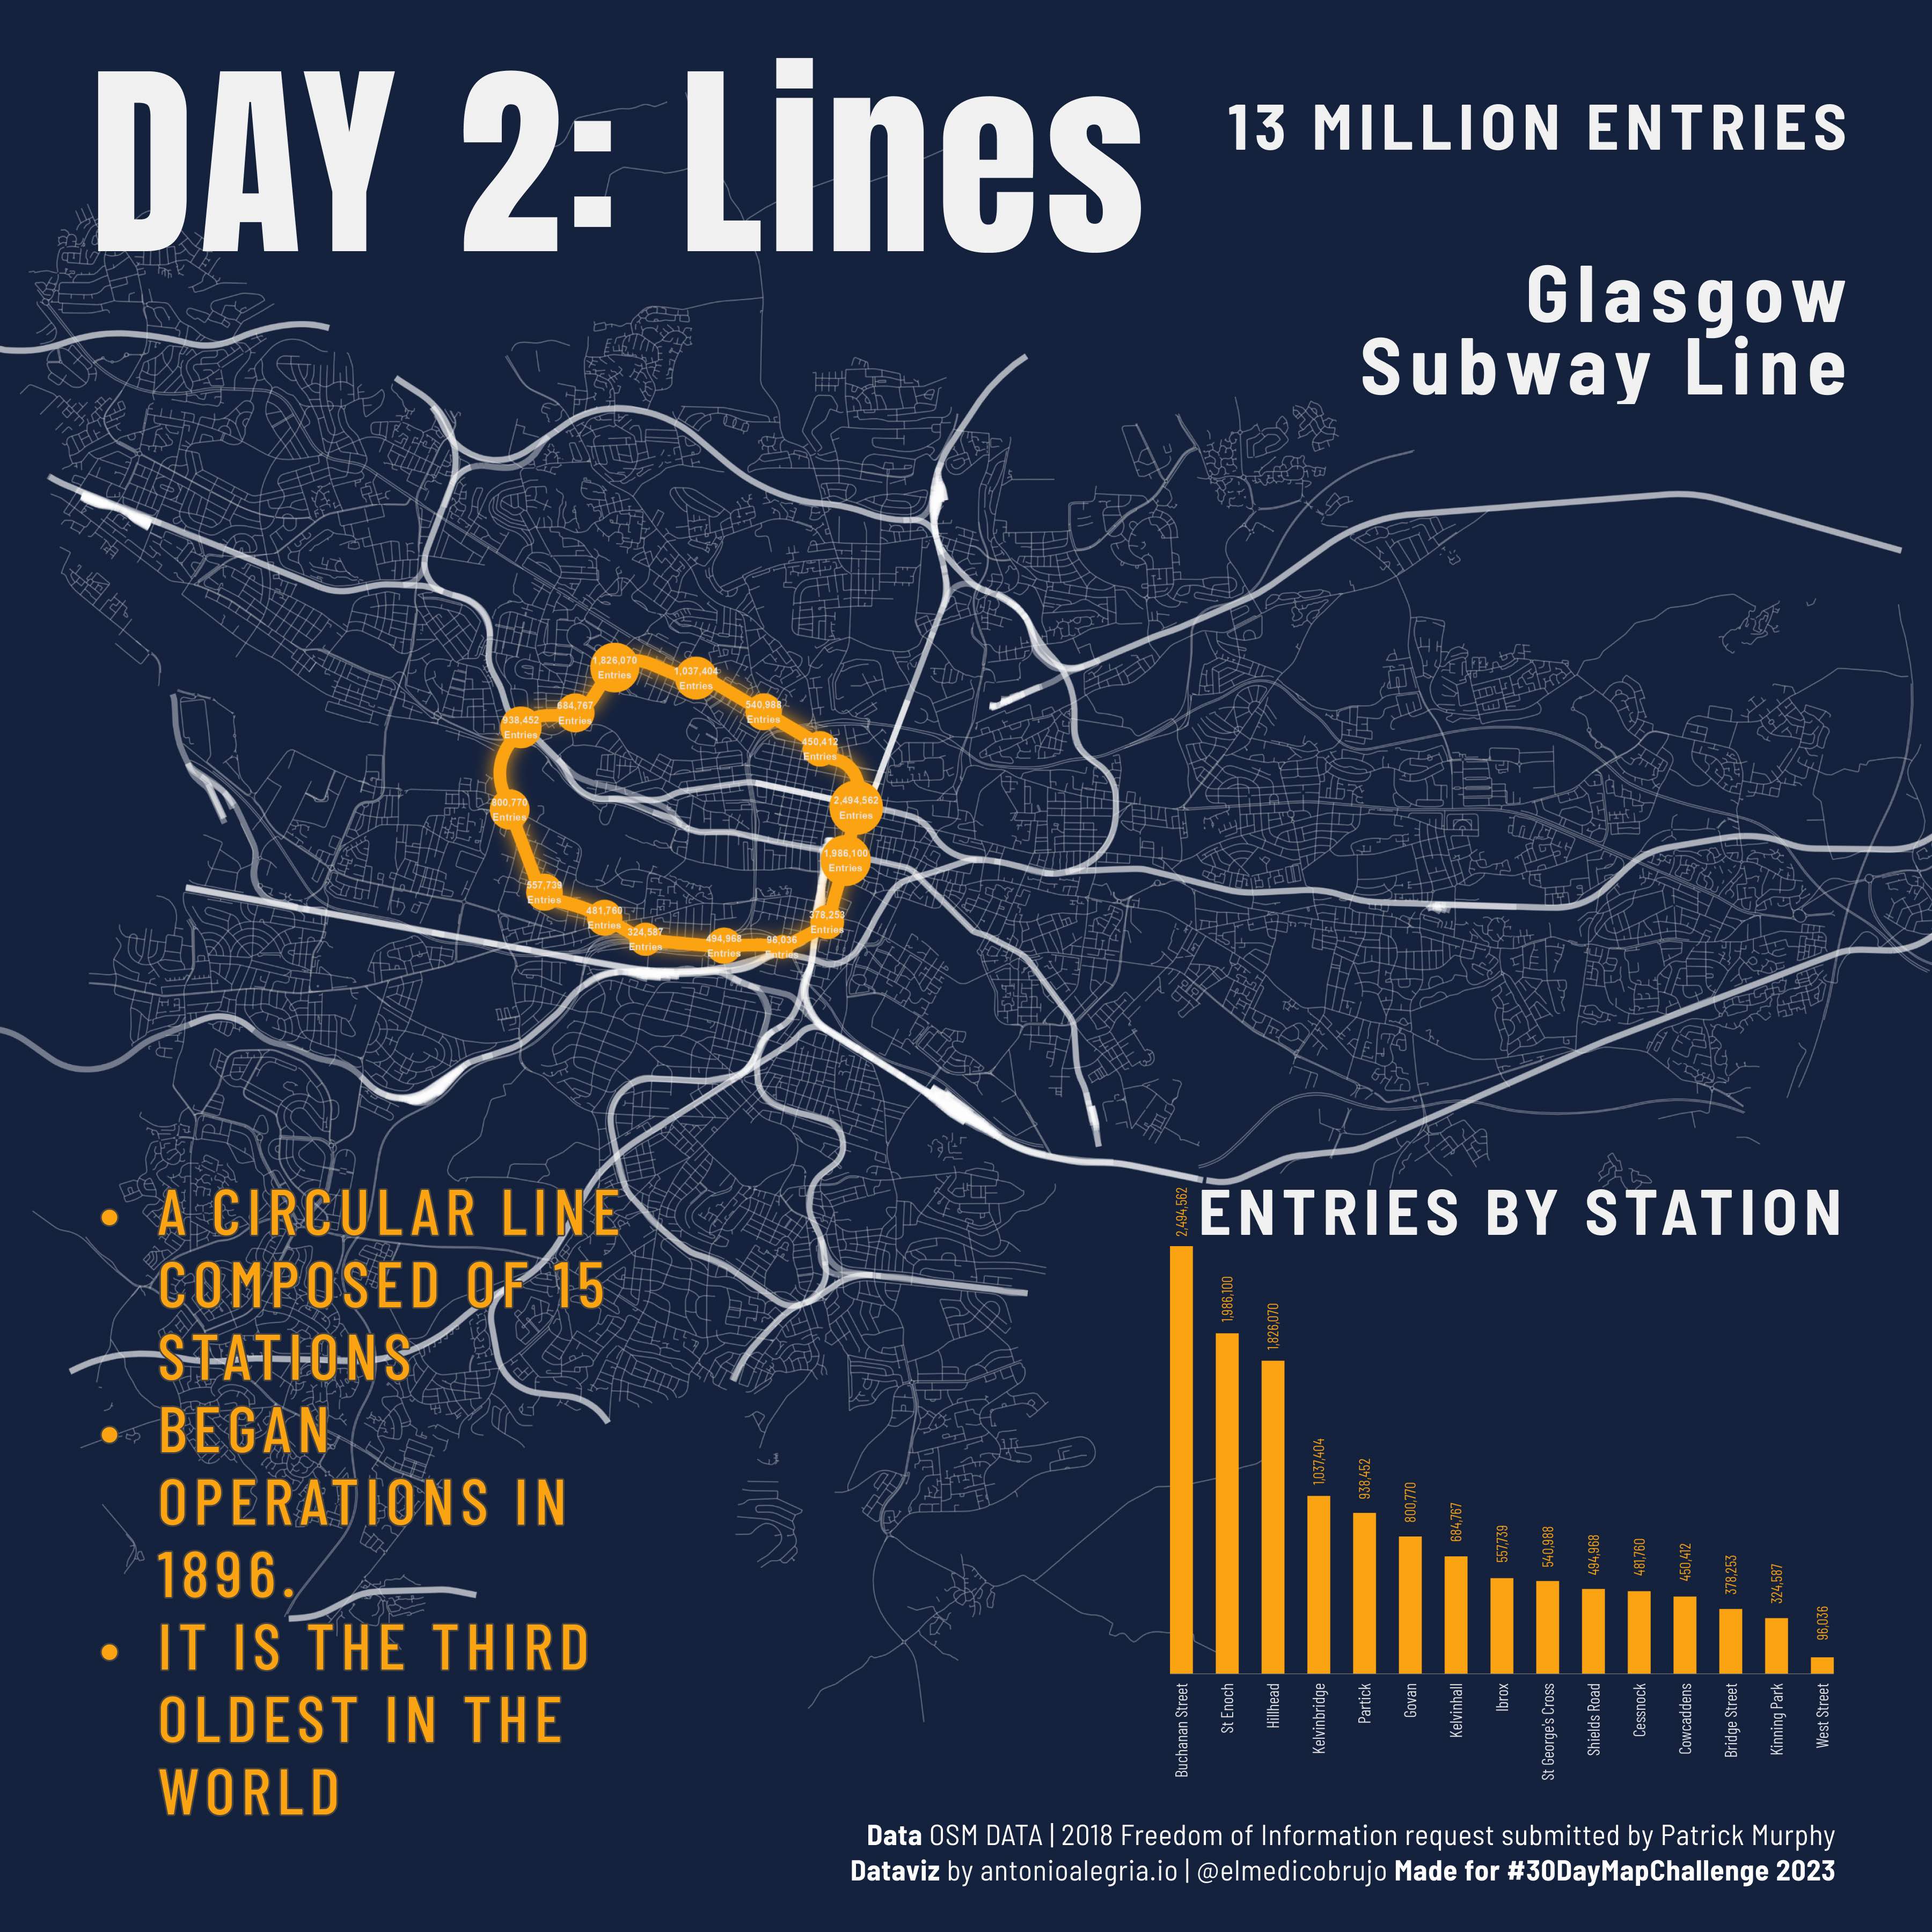
Ridership on the Glasgow Subway Line
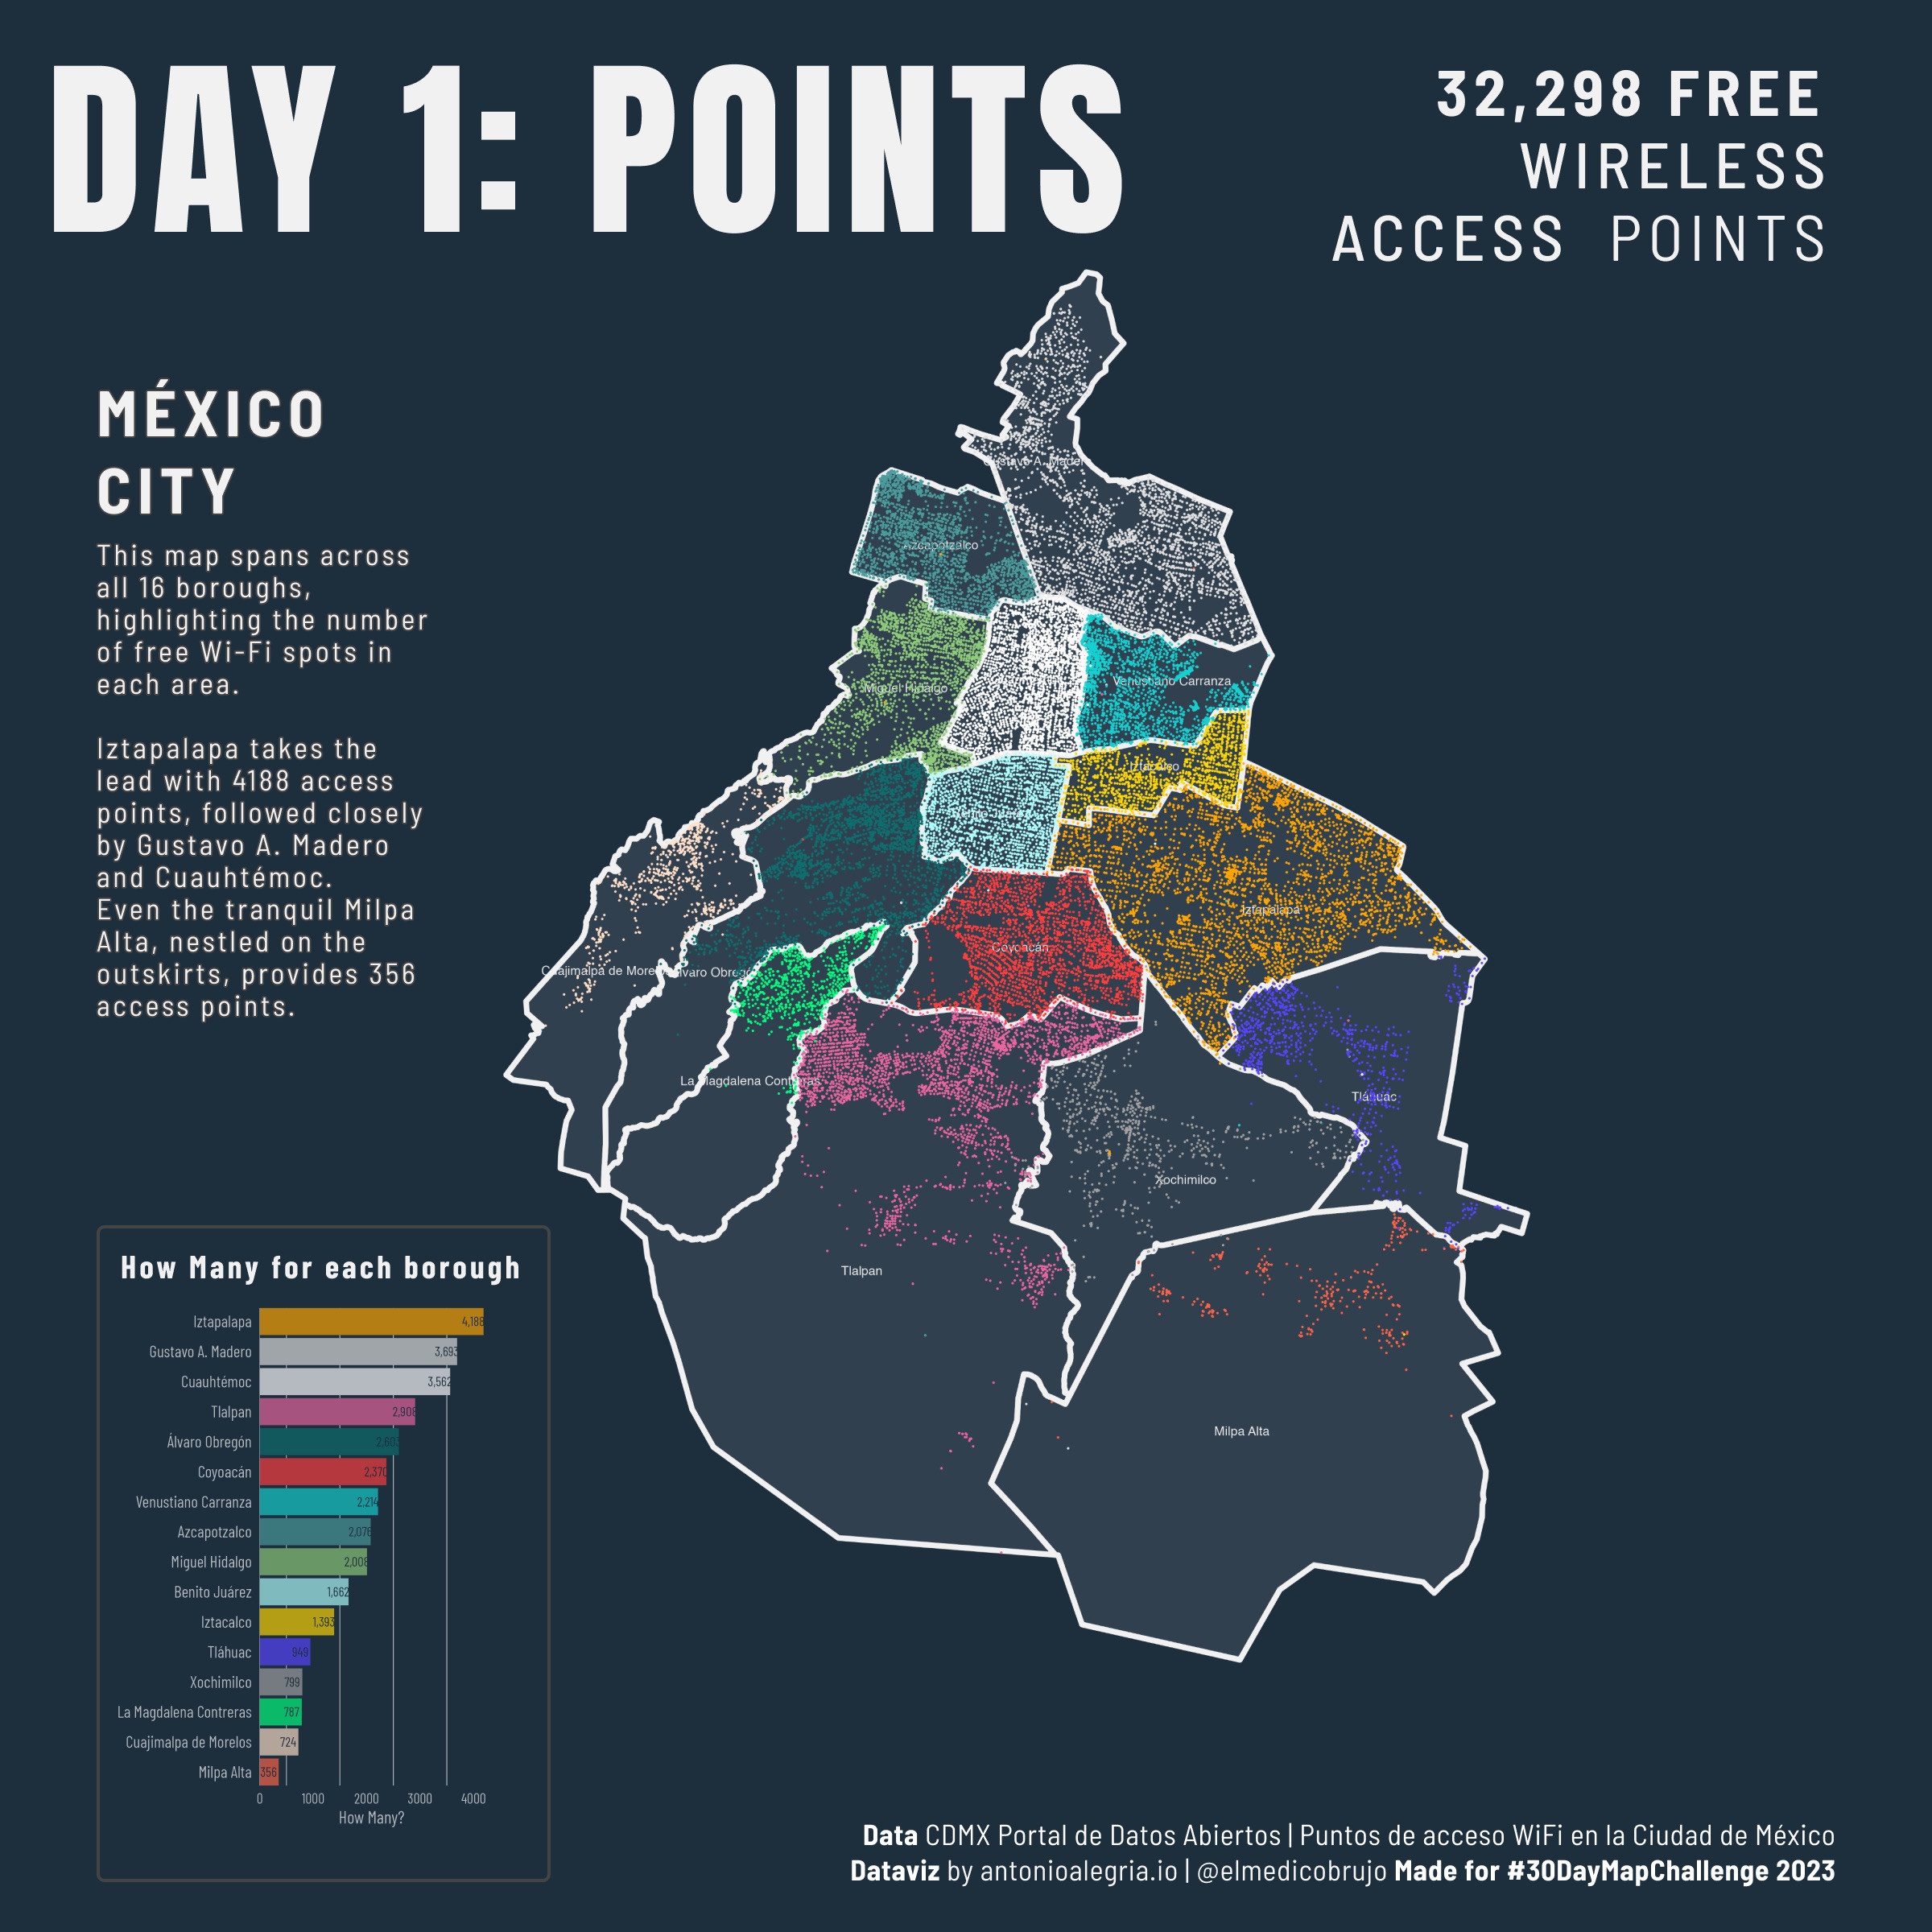
México City Wireless Access Points
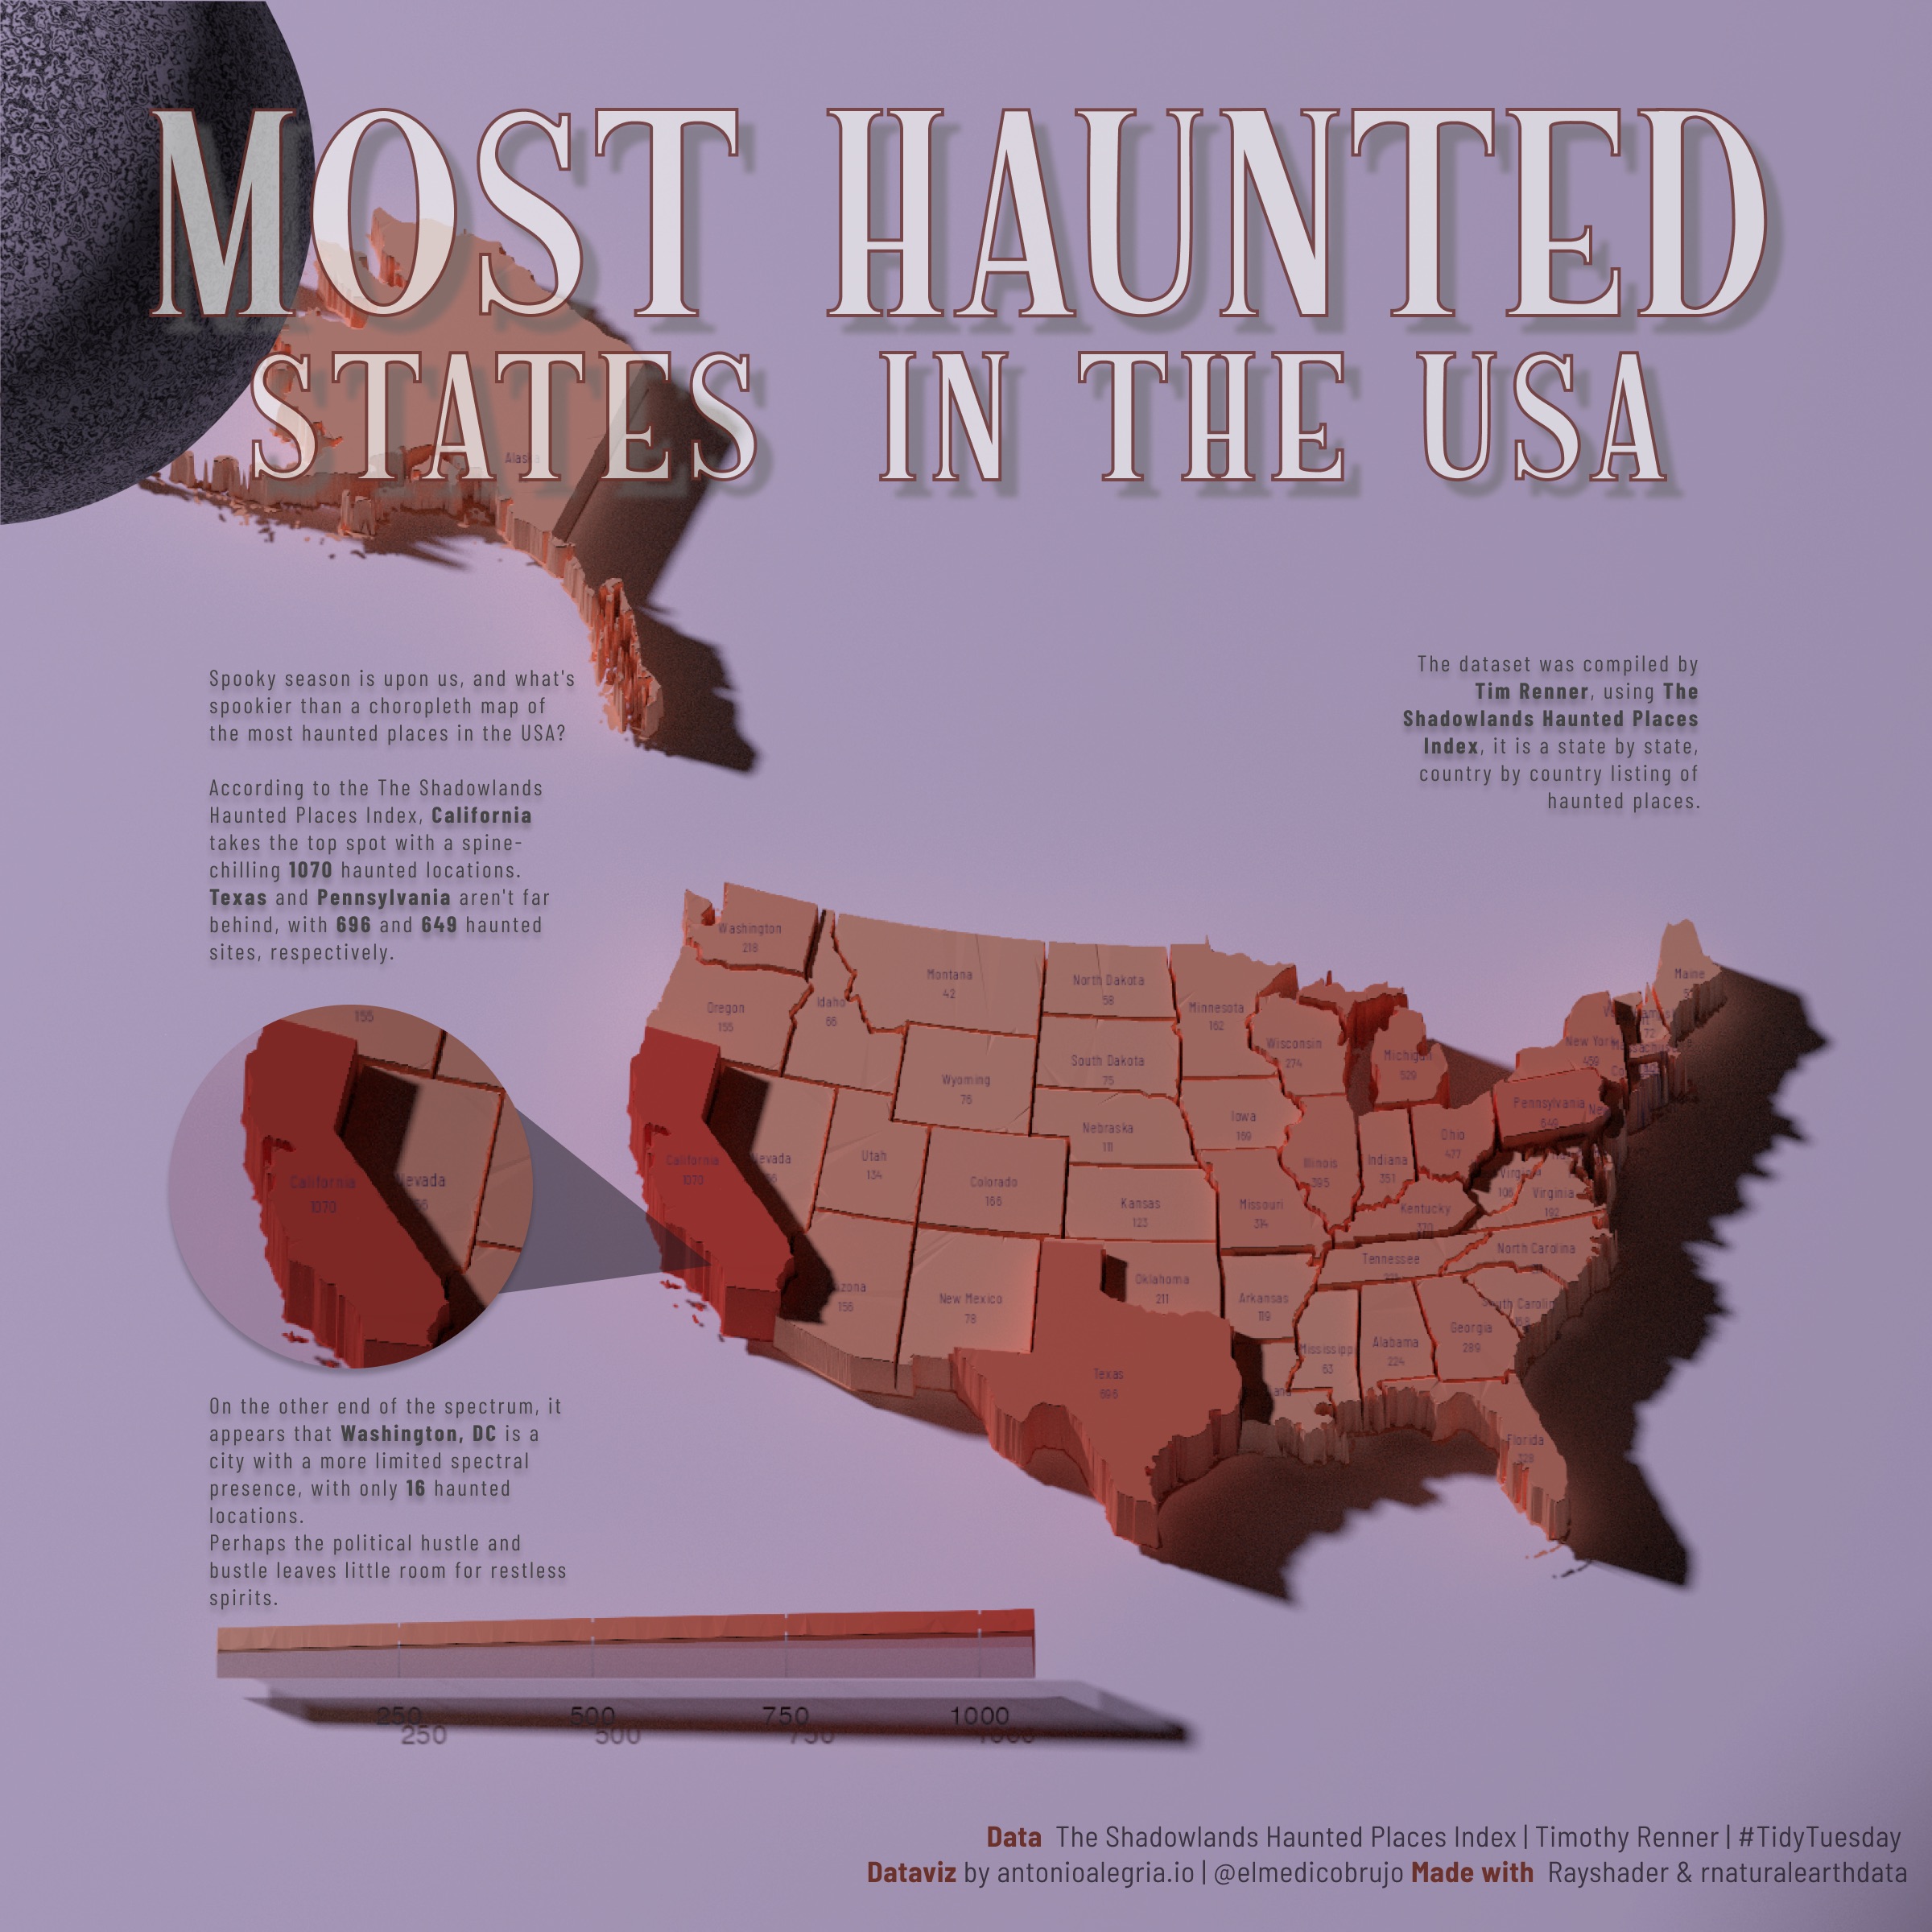
Most Haunted States in the USA
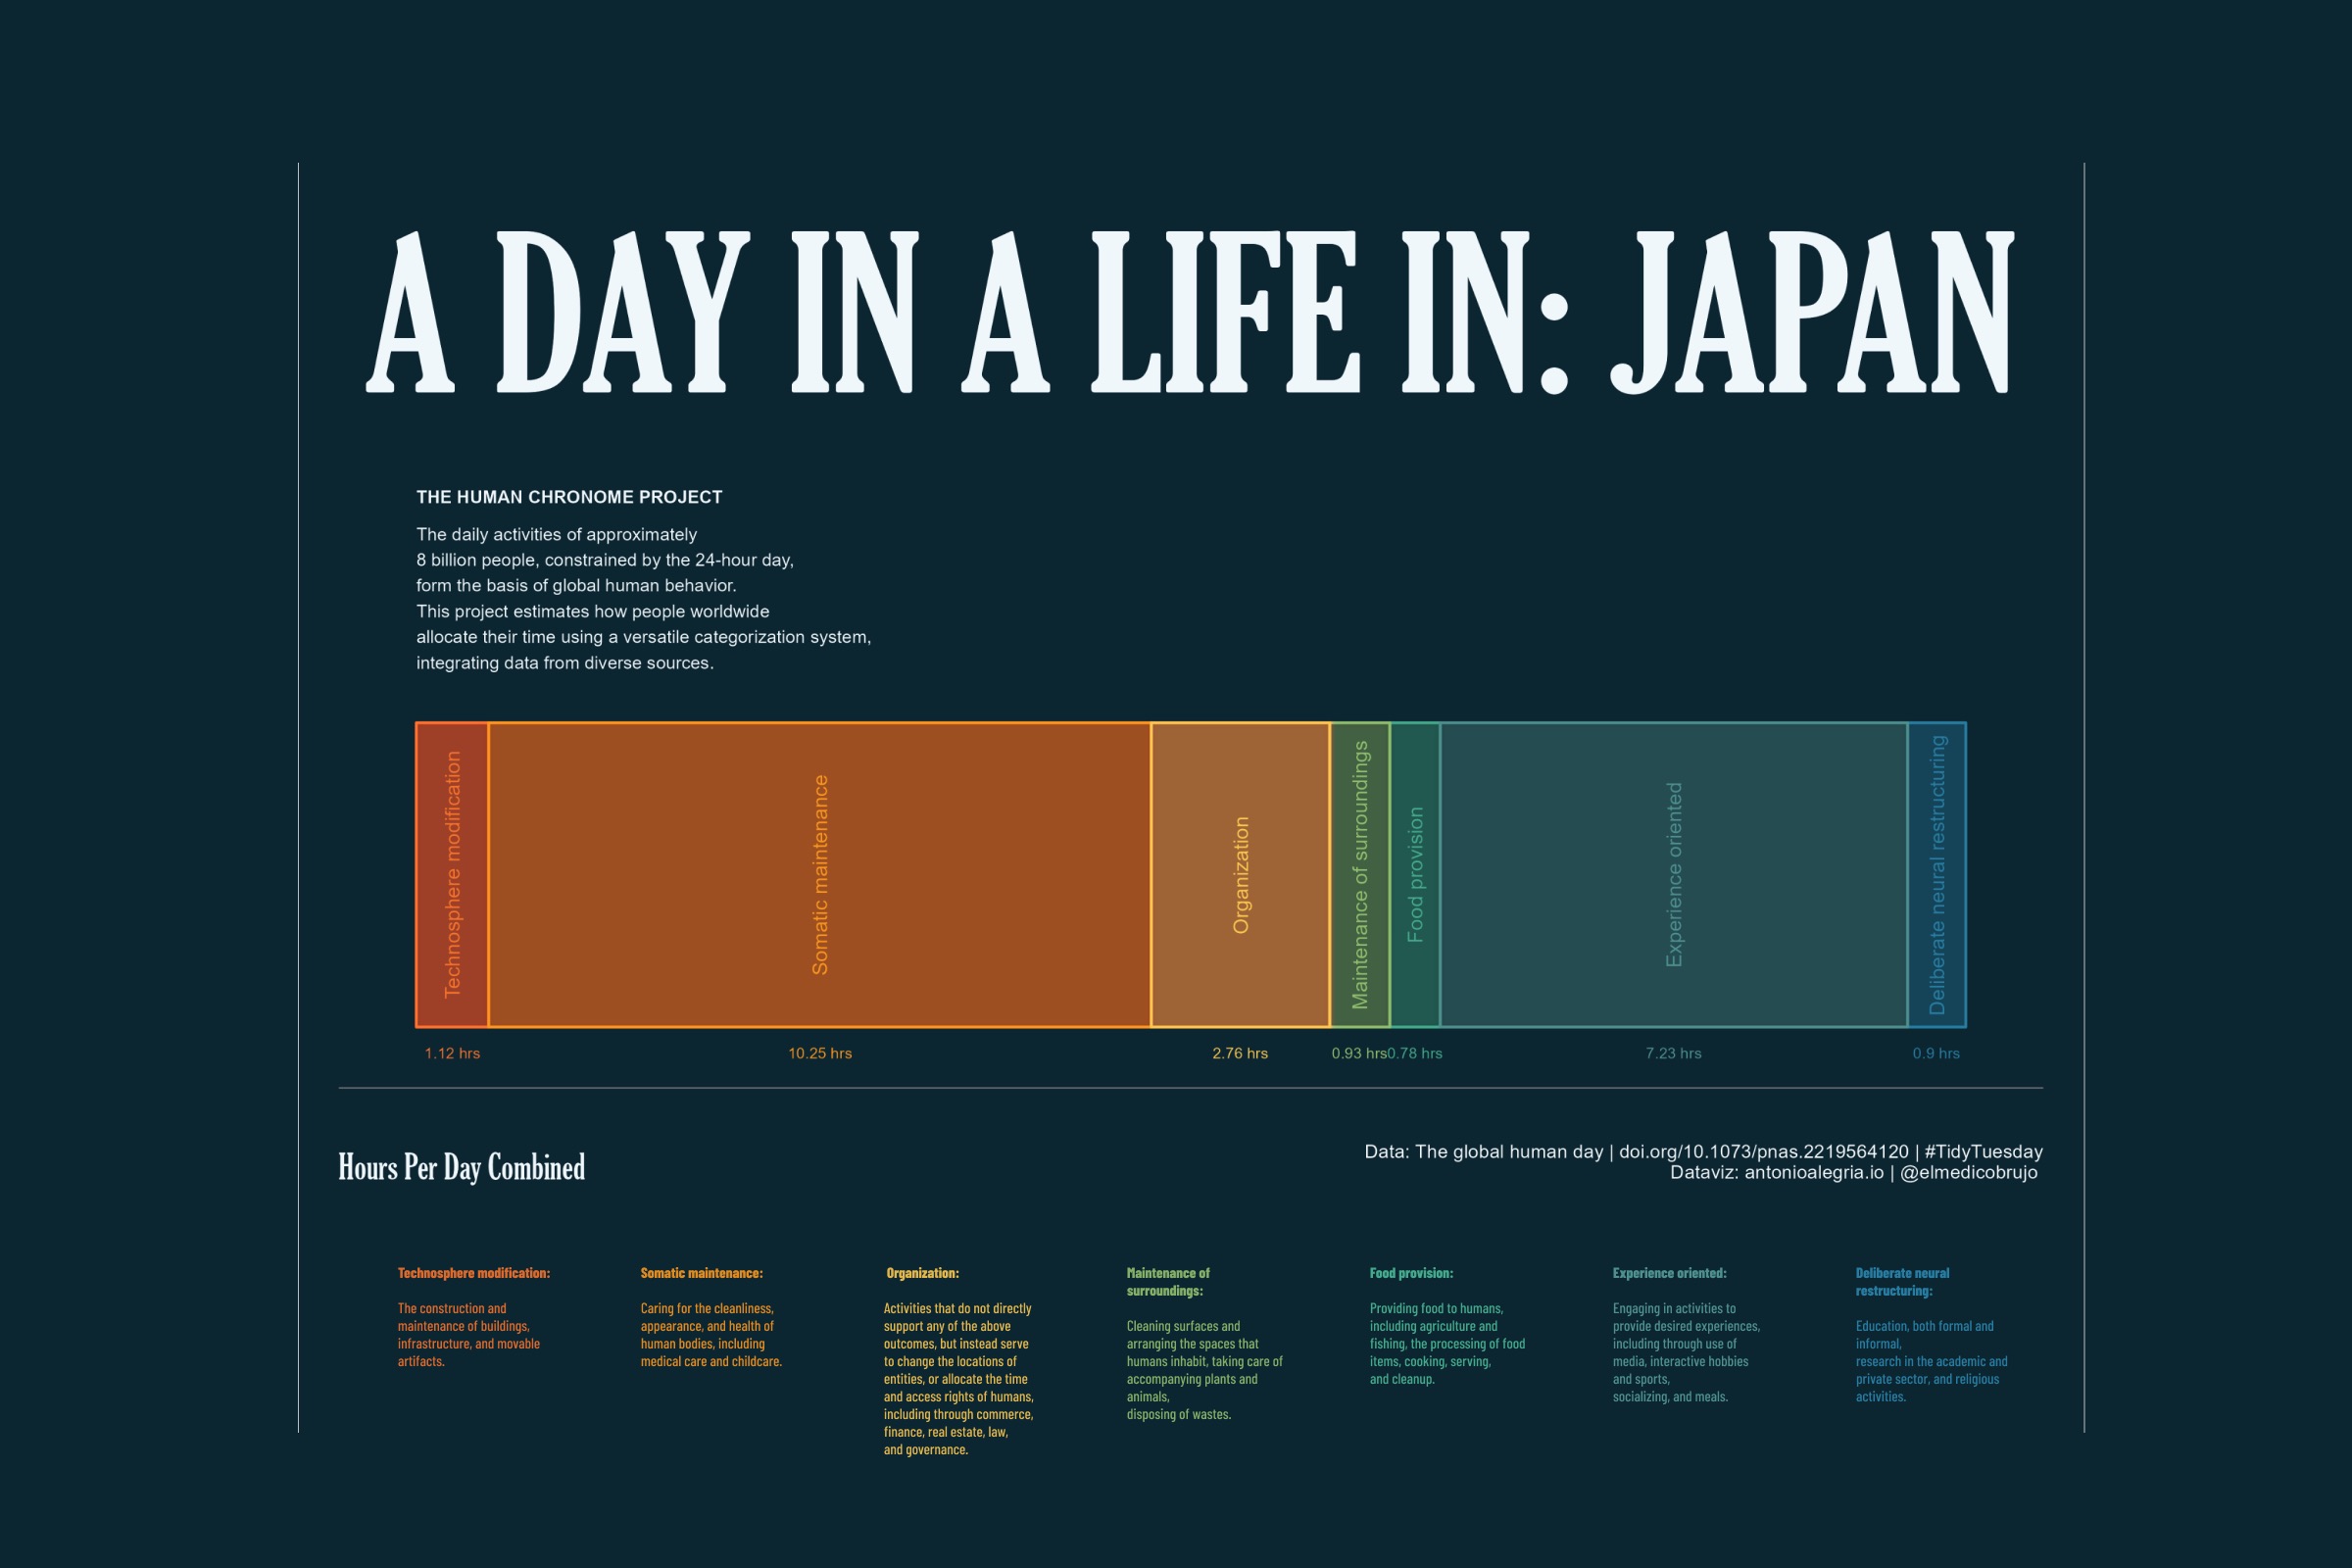
Understanding Worldwide Time Allocation Patterns: A Data Visualization Project
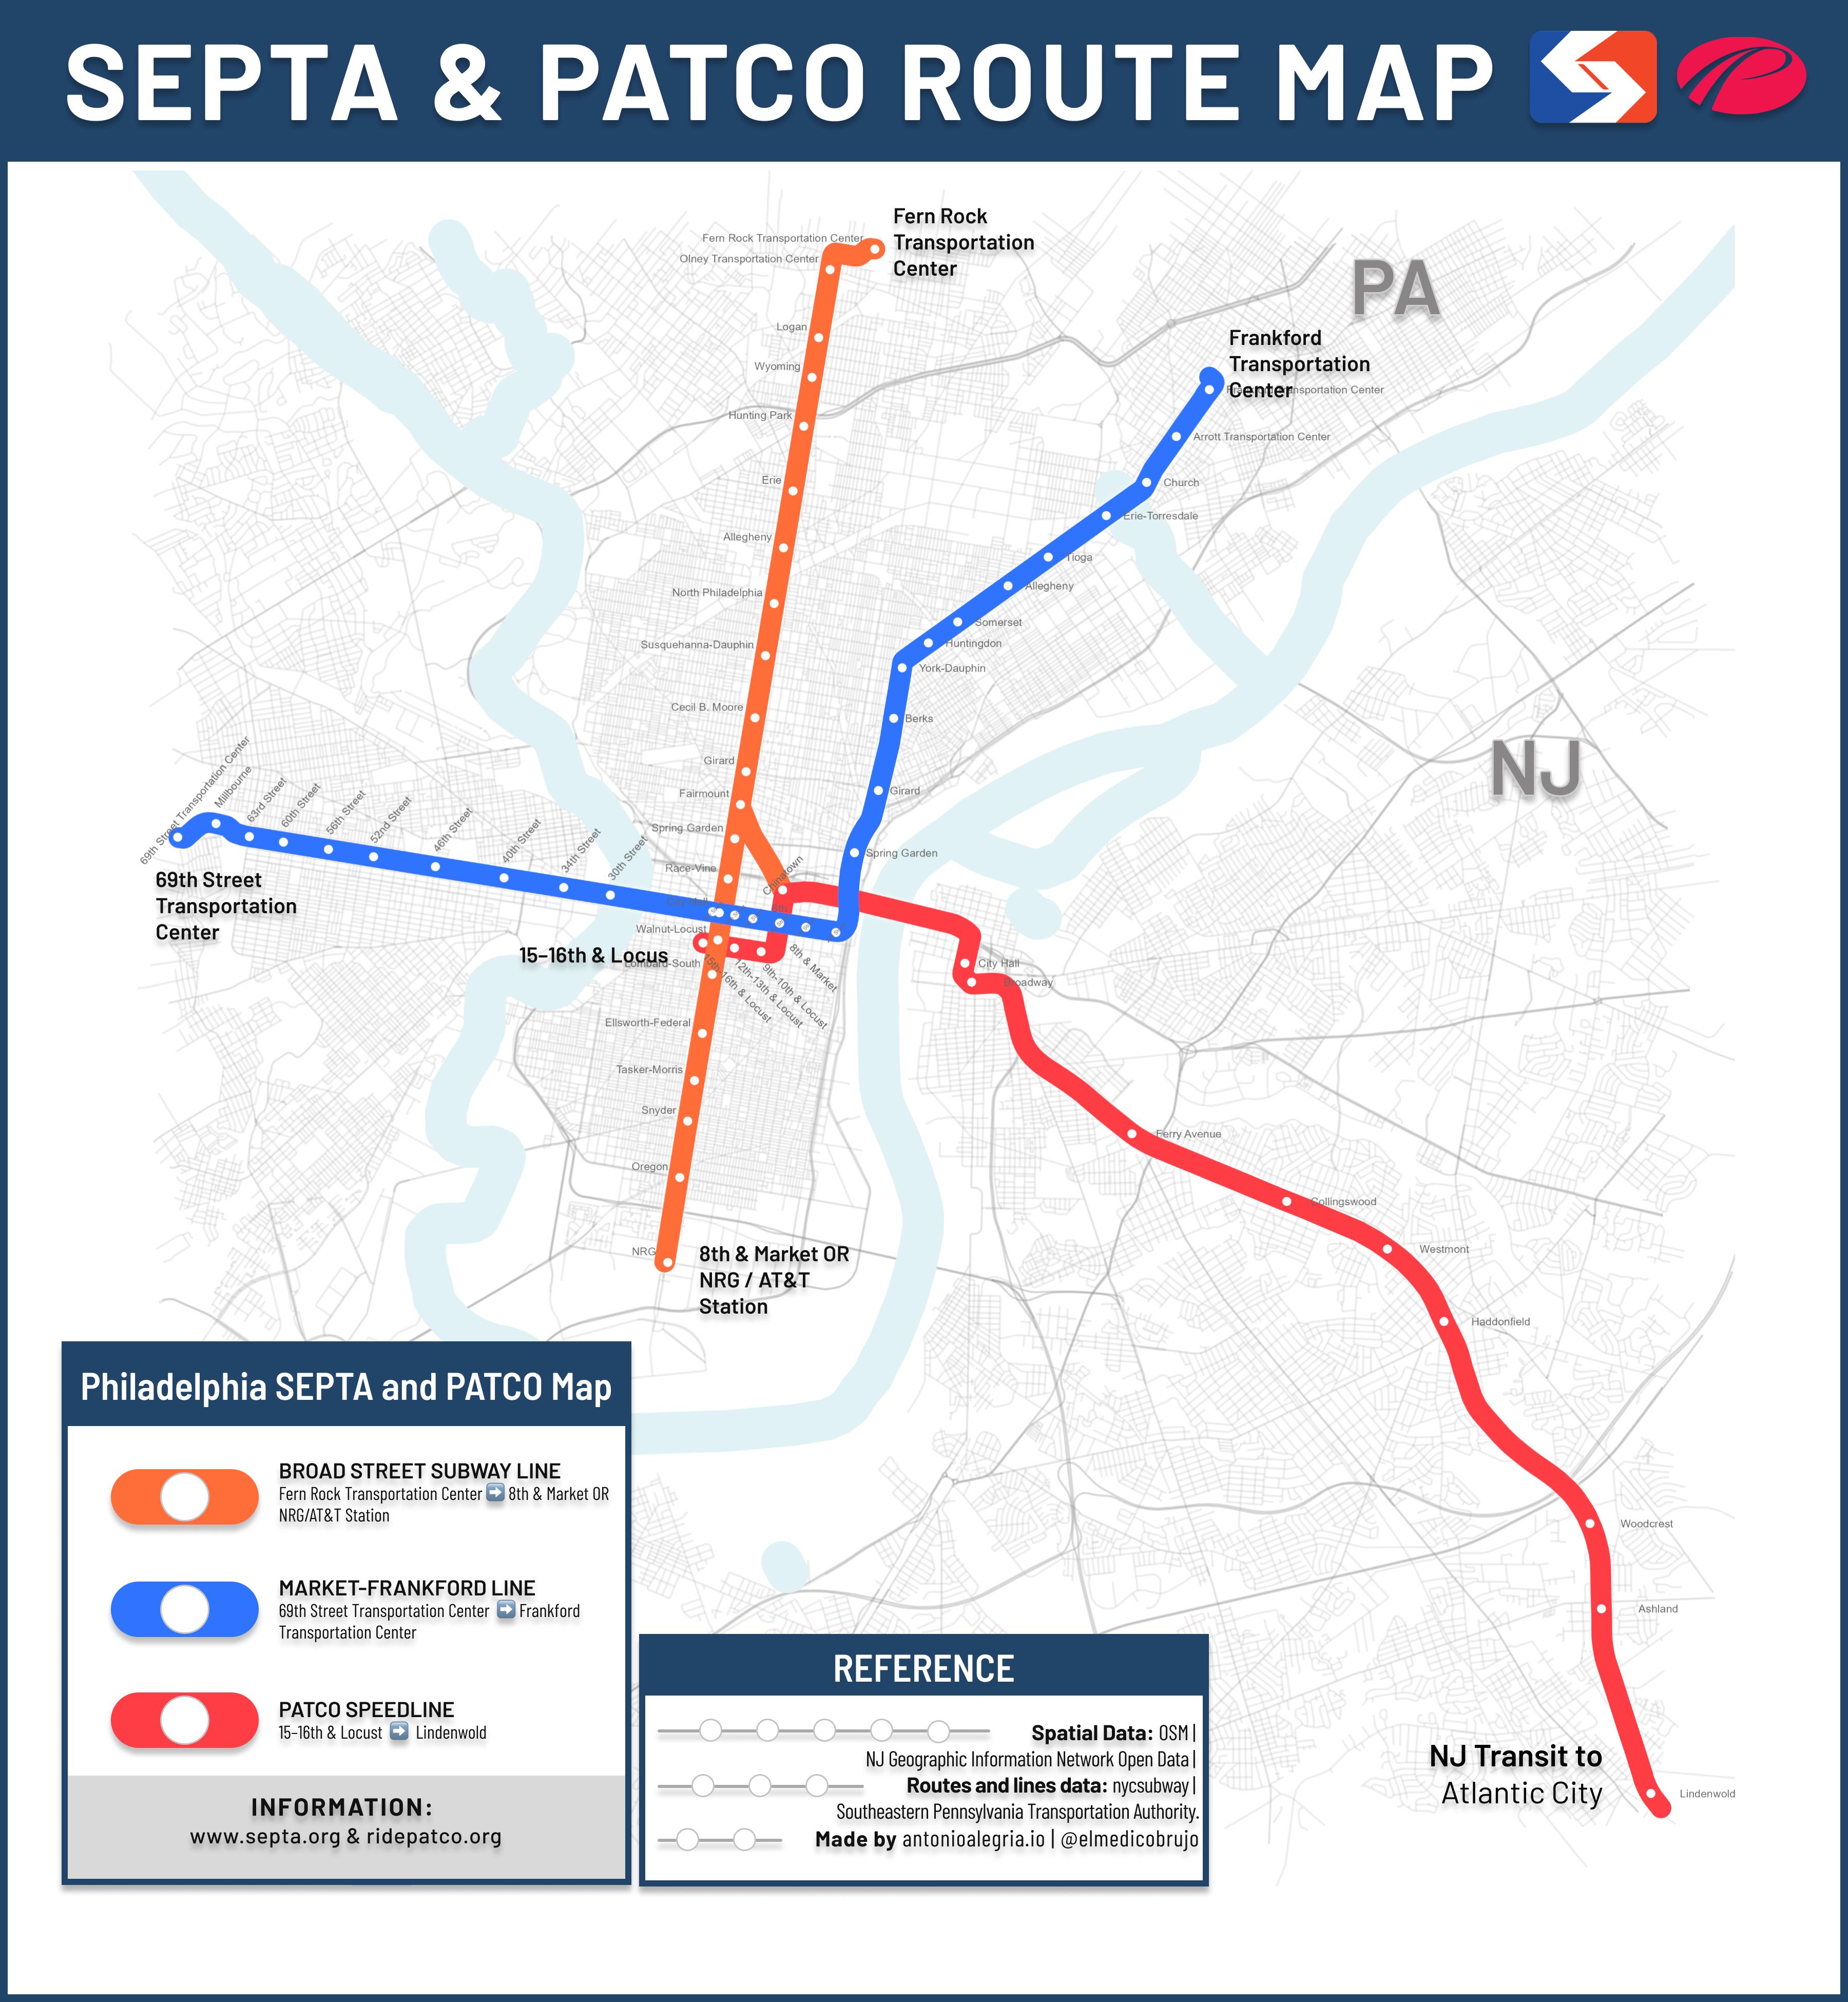
Detailed SEPTA & PATCO rail map designed in R
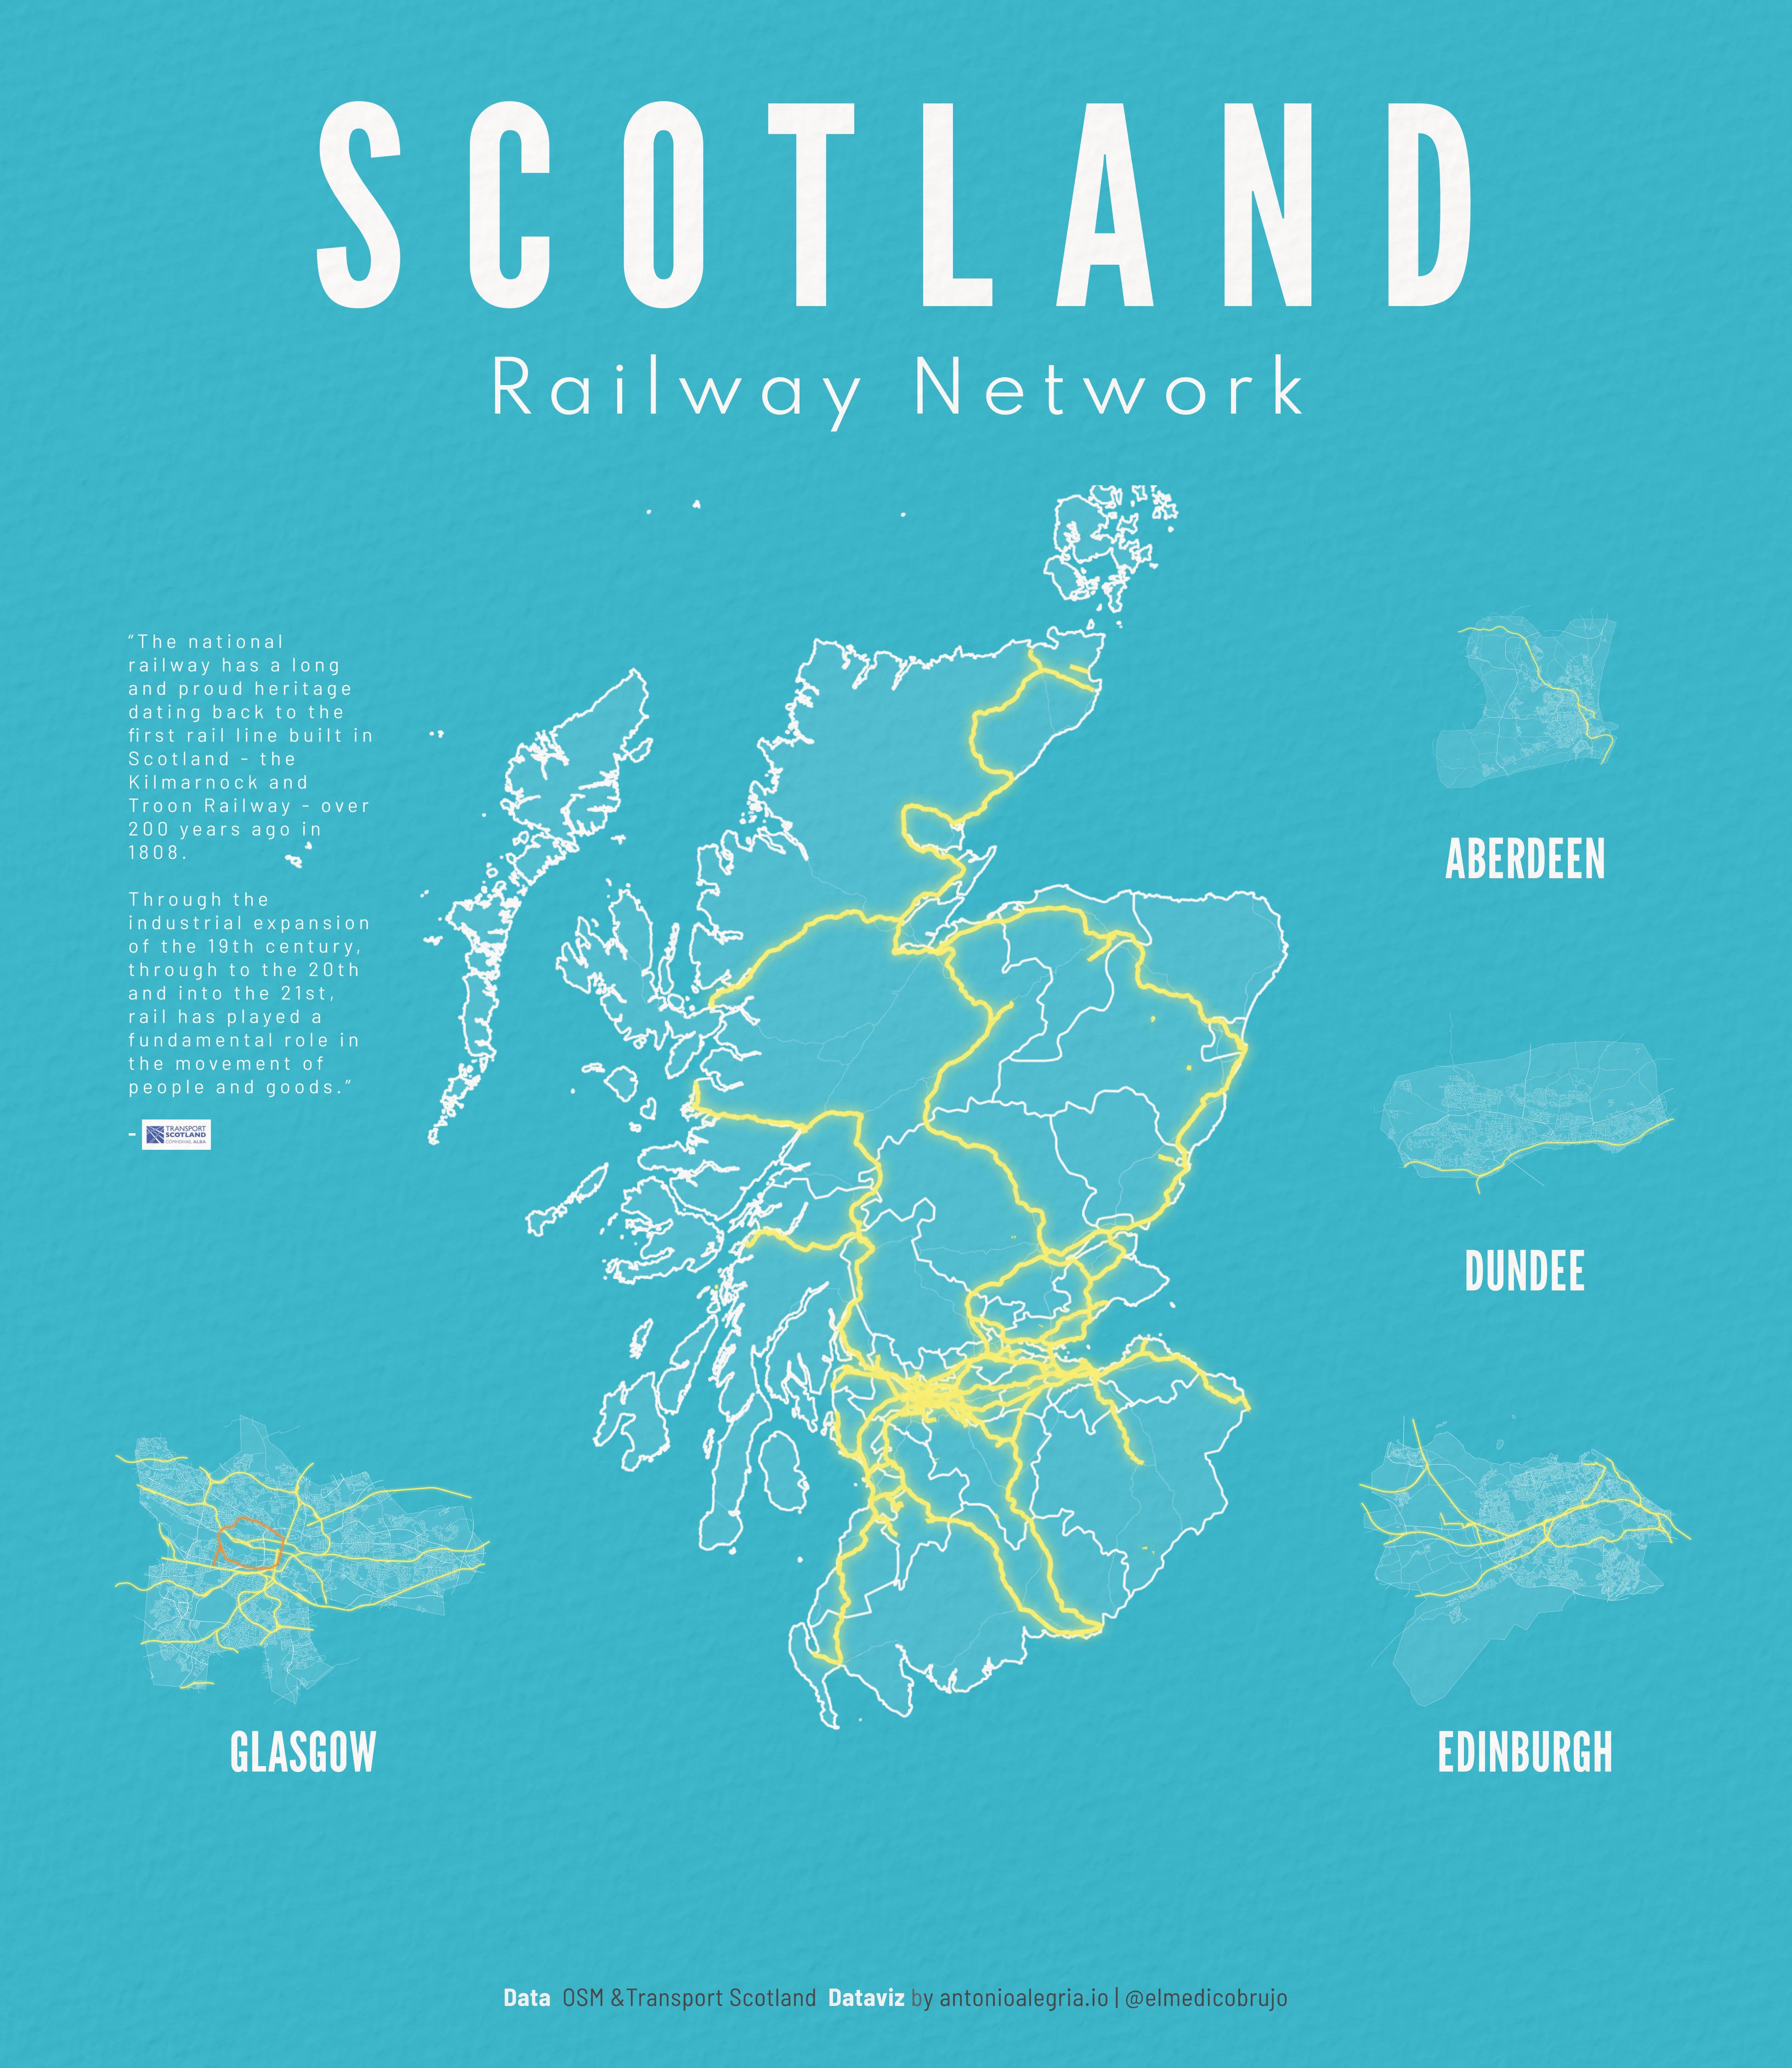
Map Of Scotland's Railway Network
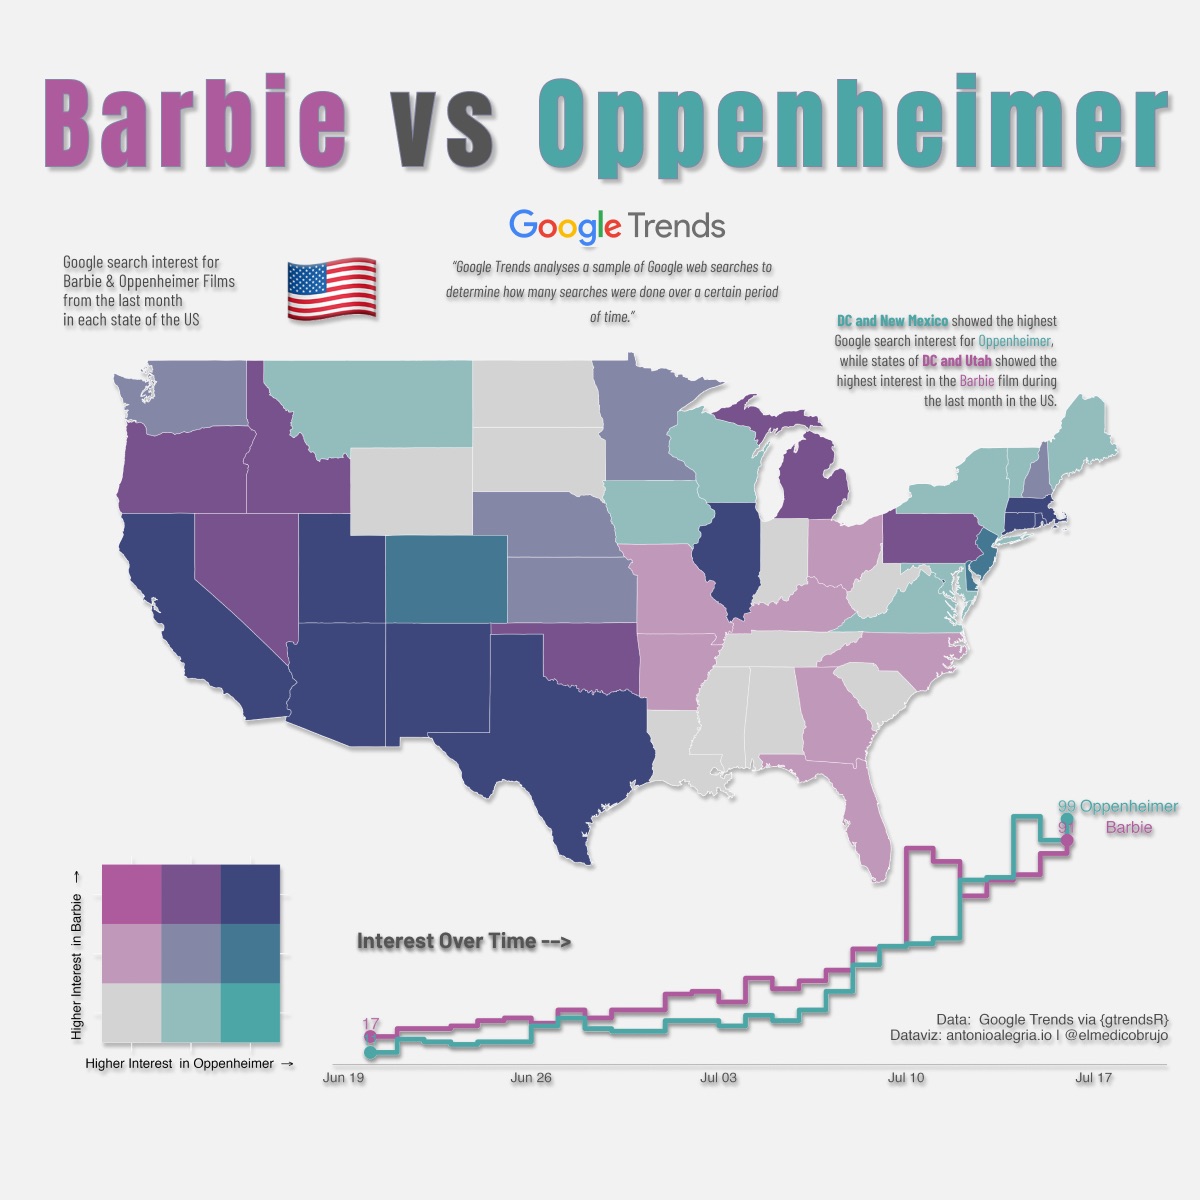
Barbie & Oppenheimer movie trends in the USA
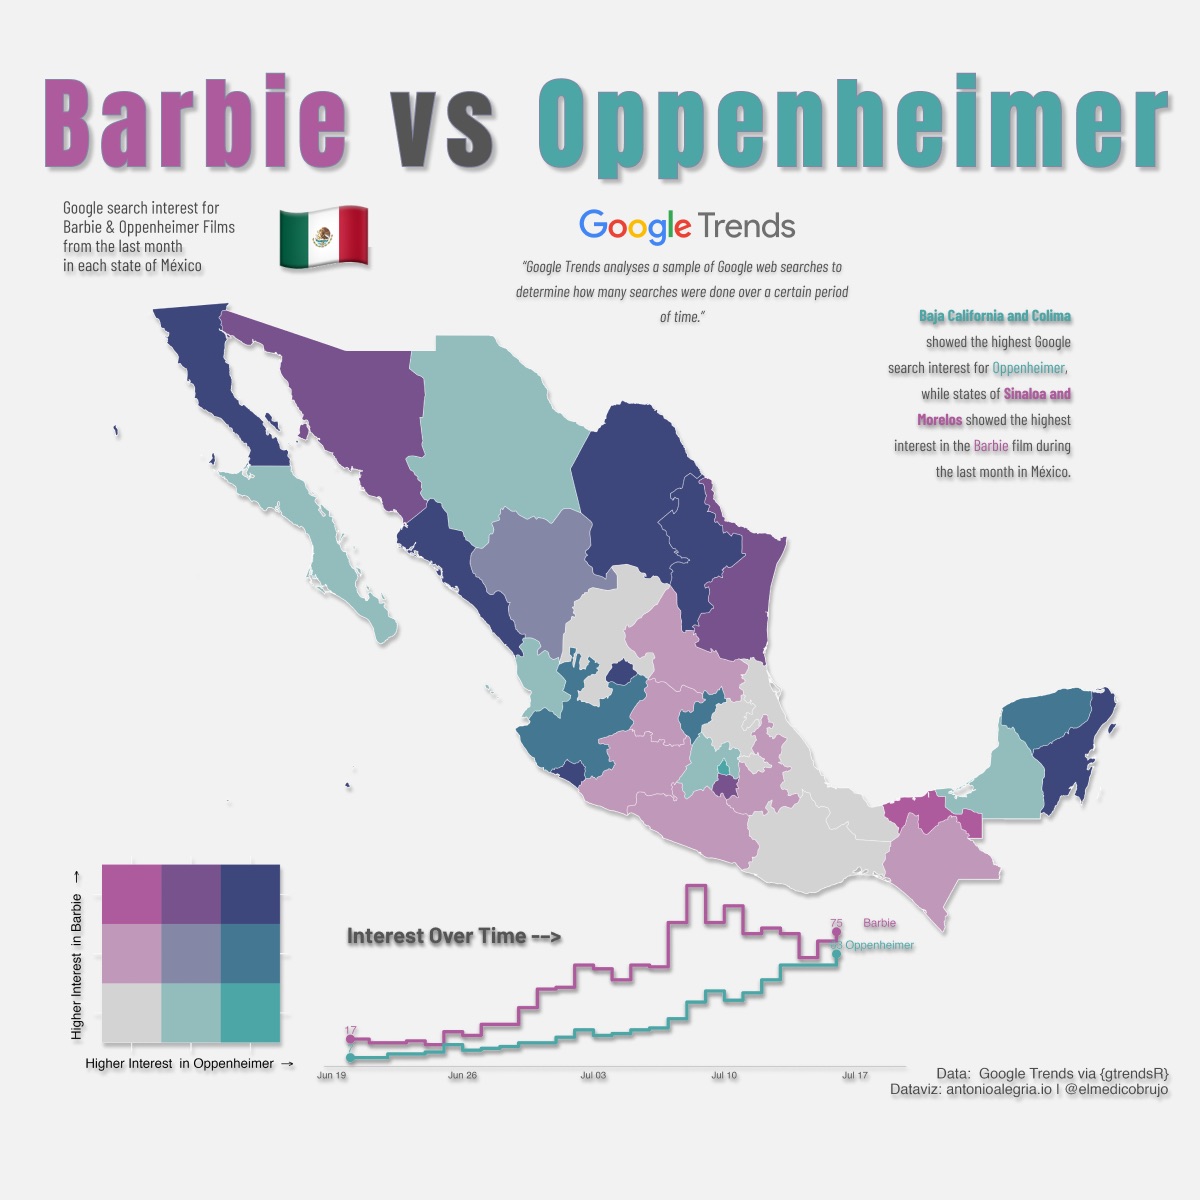
Barbie & Oppenheimer movie trends in México
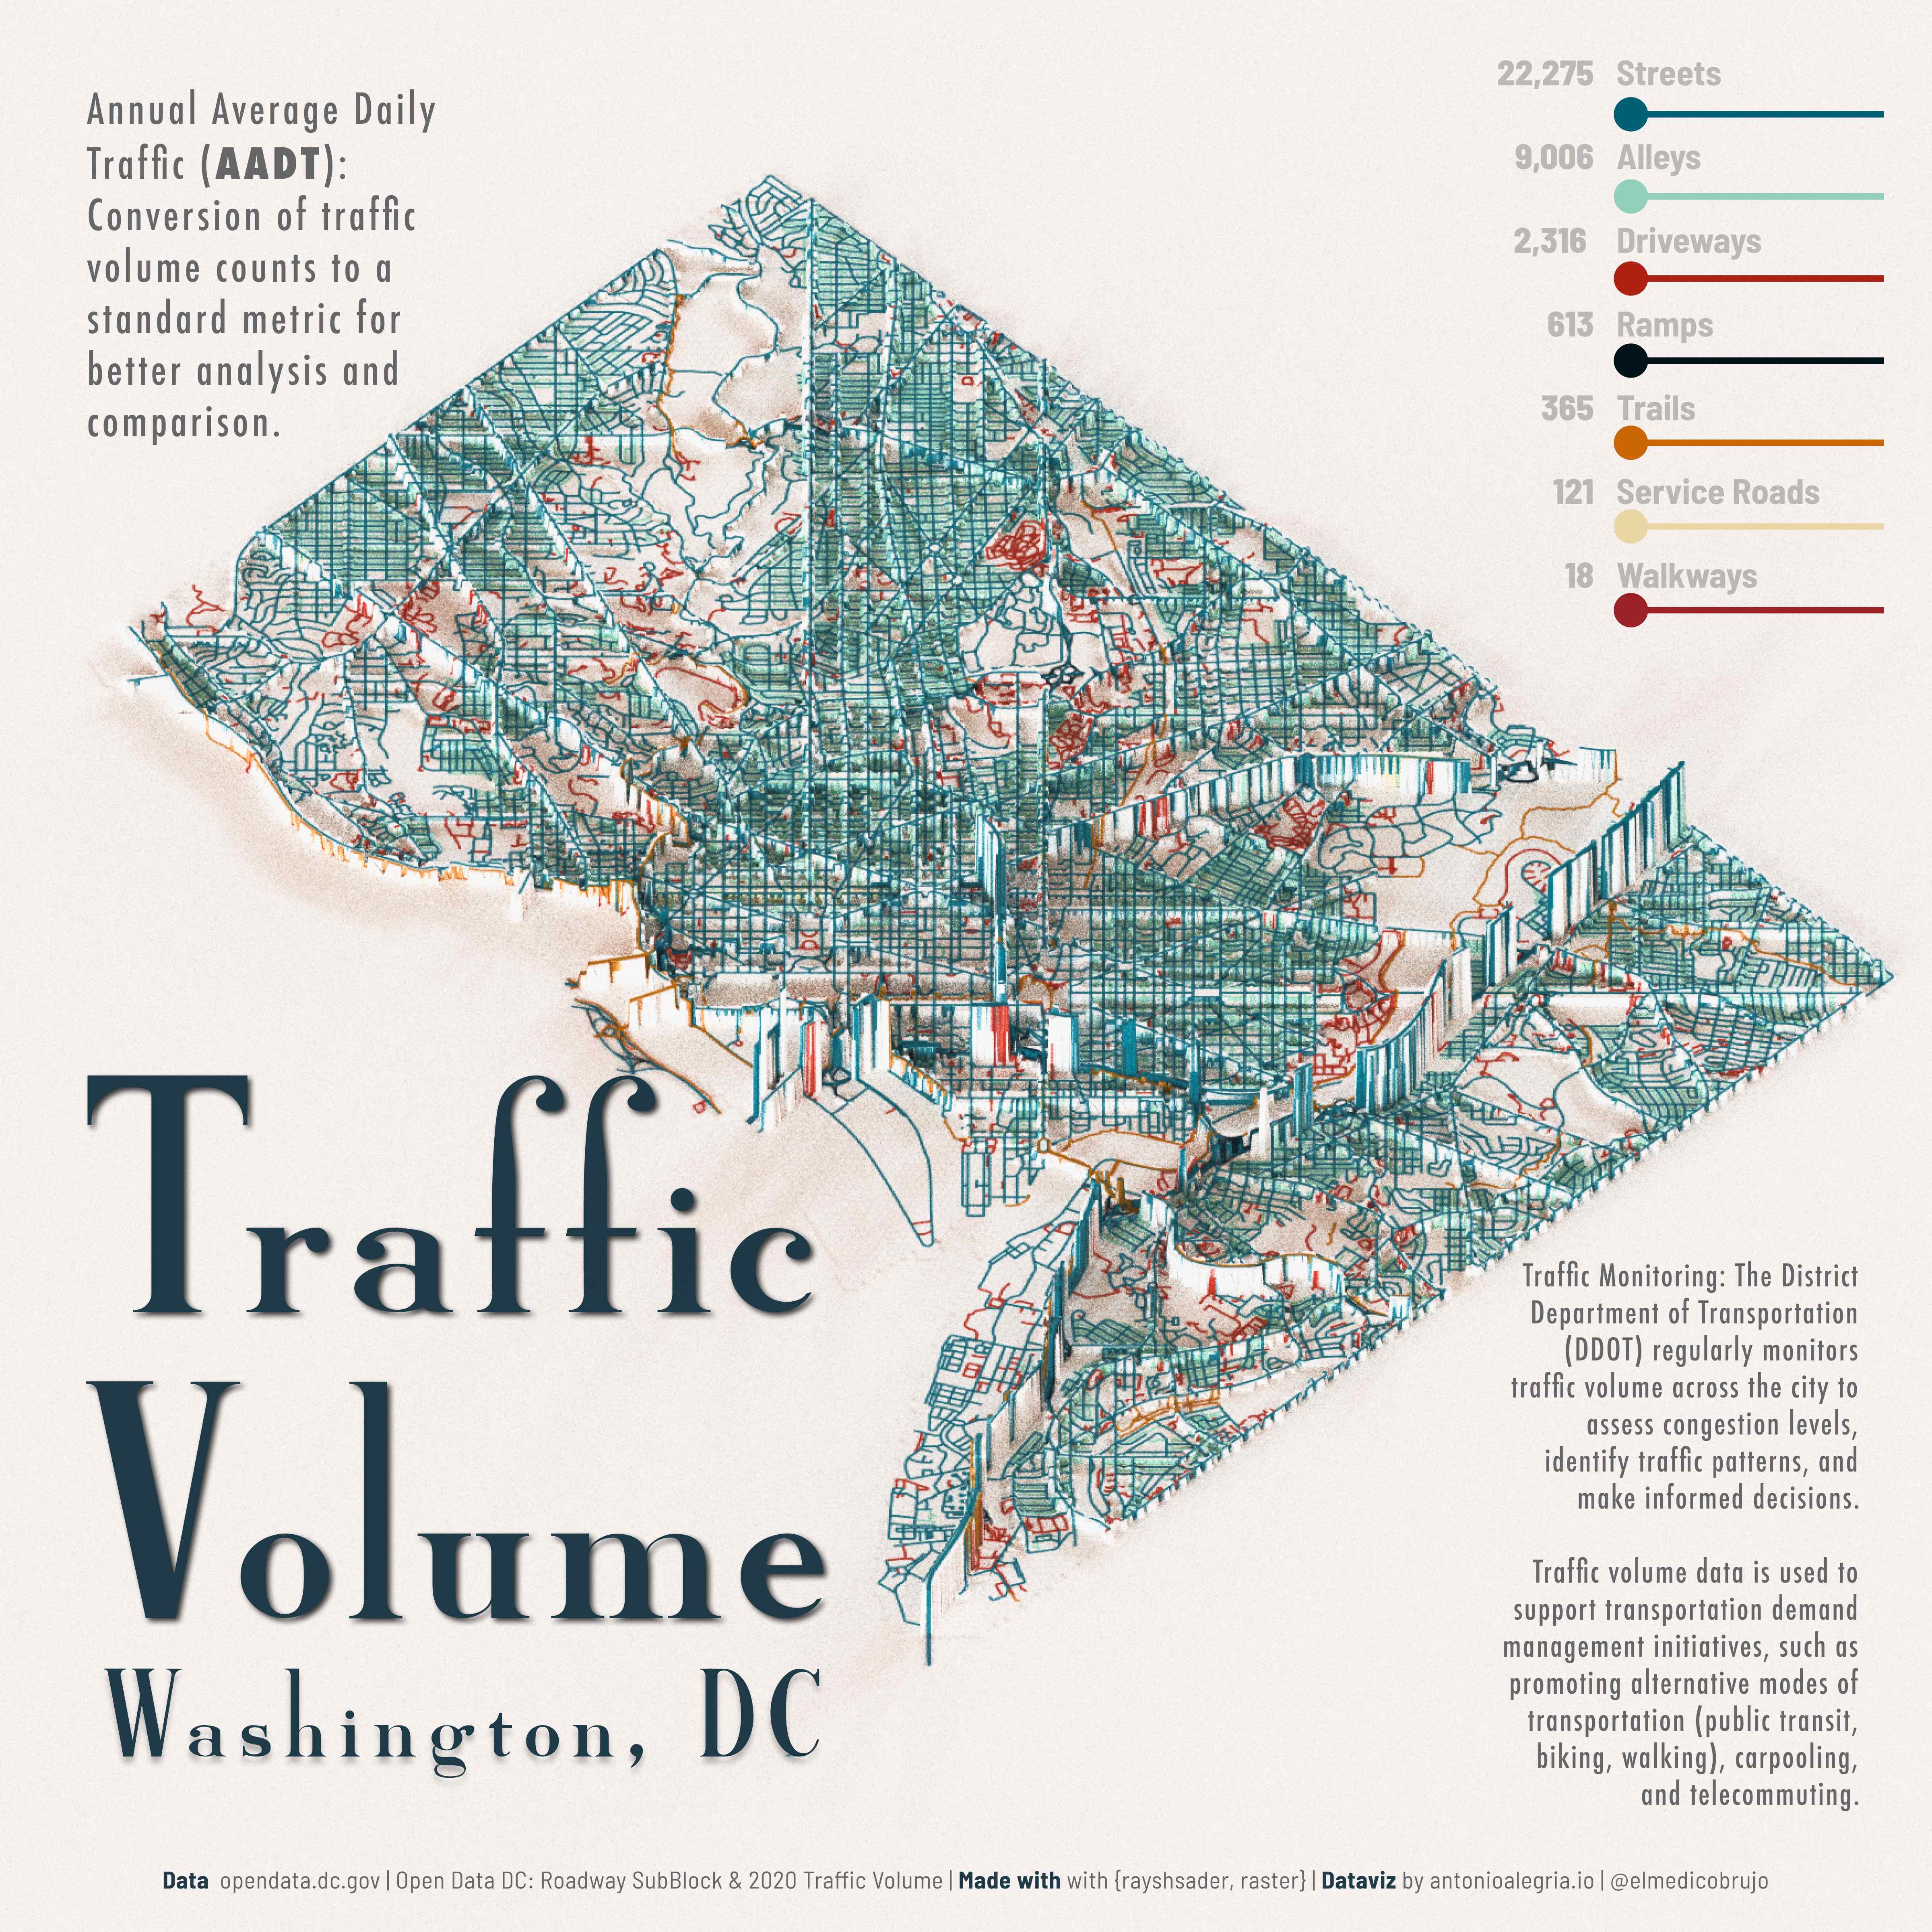
Traffic Volume Map of Washington, D.C

Every F*ck in Succession
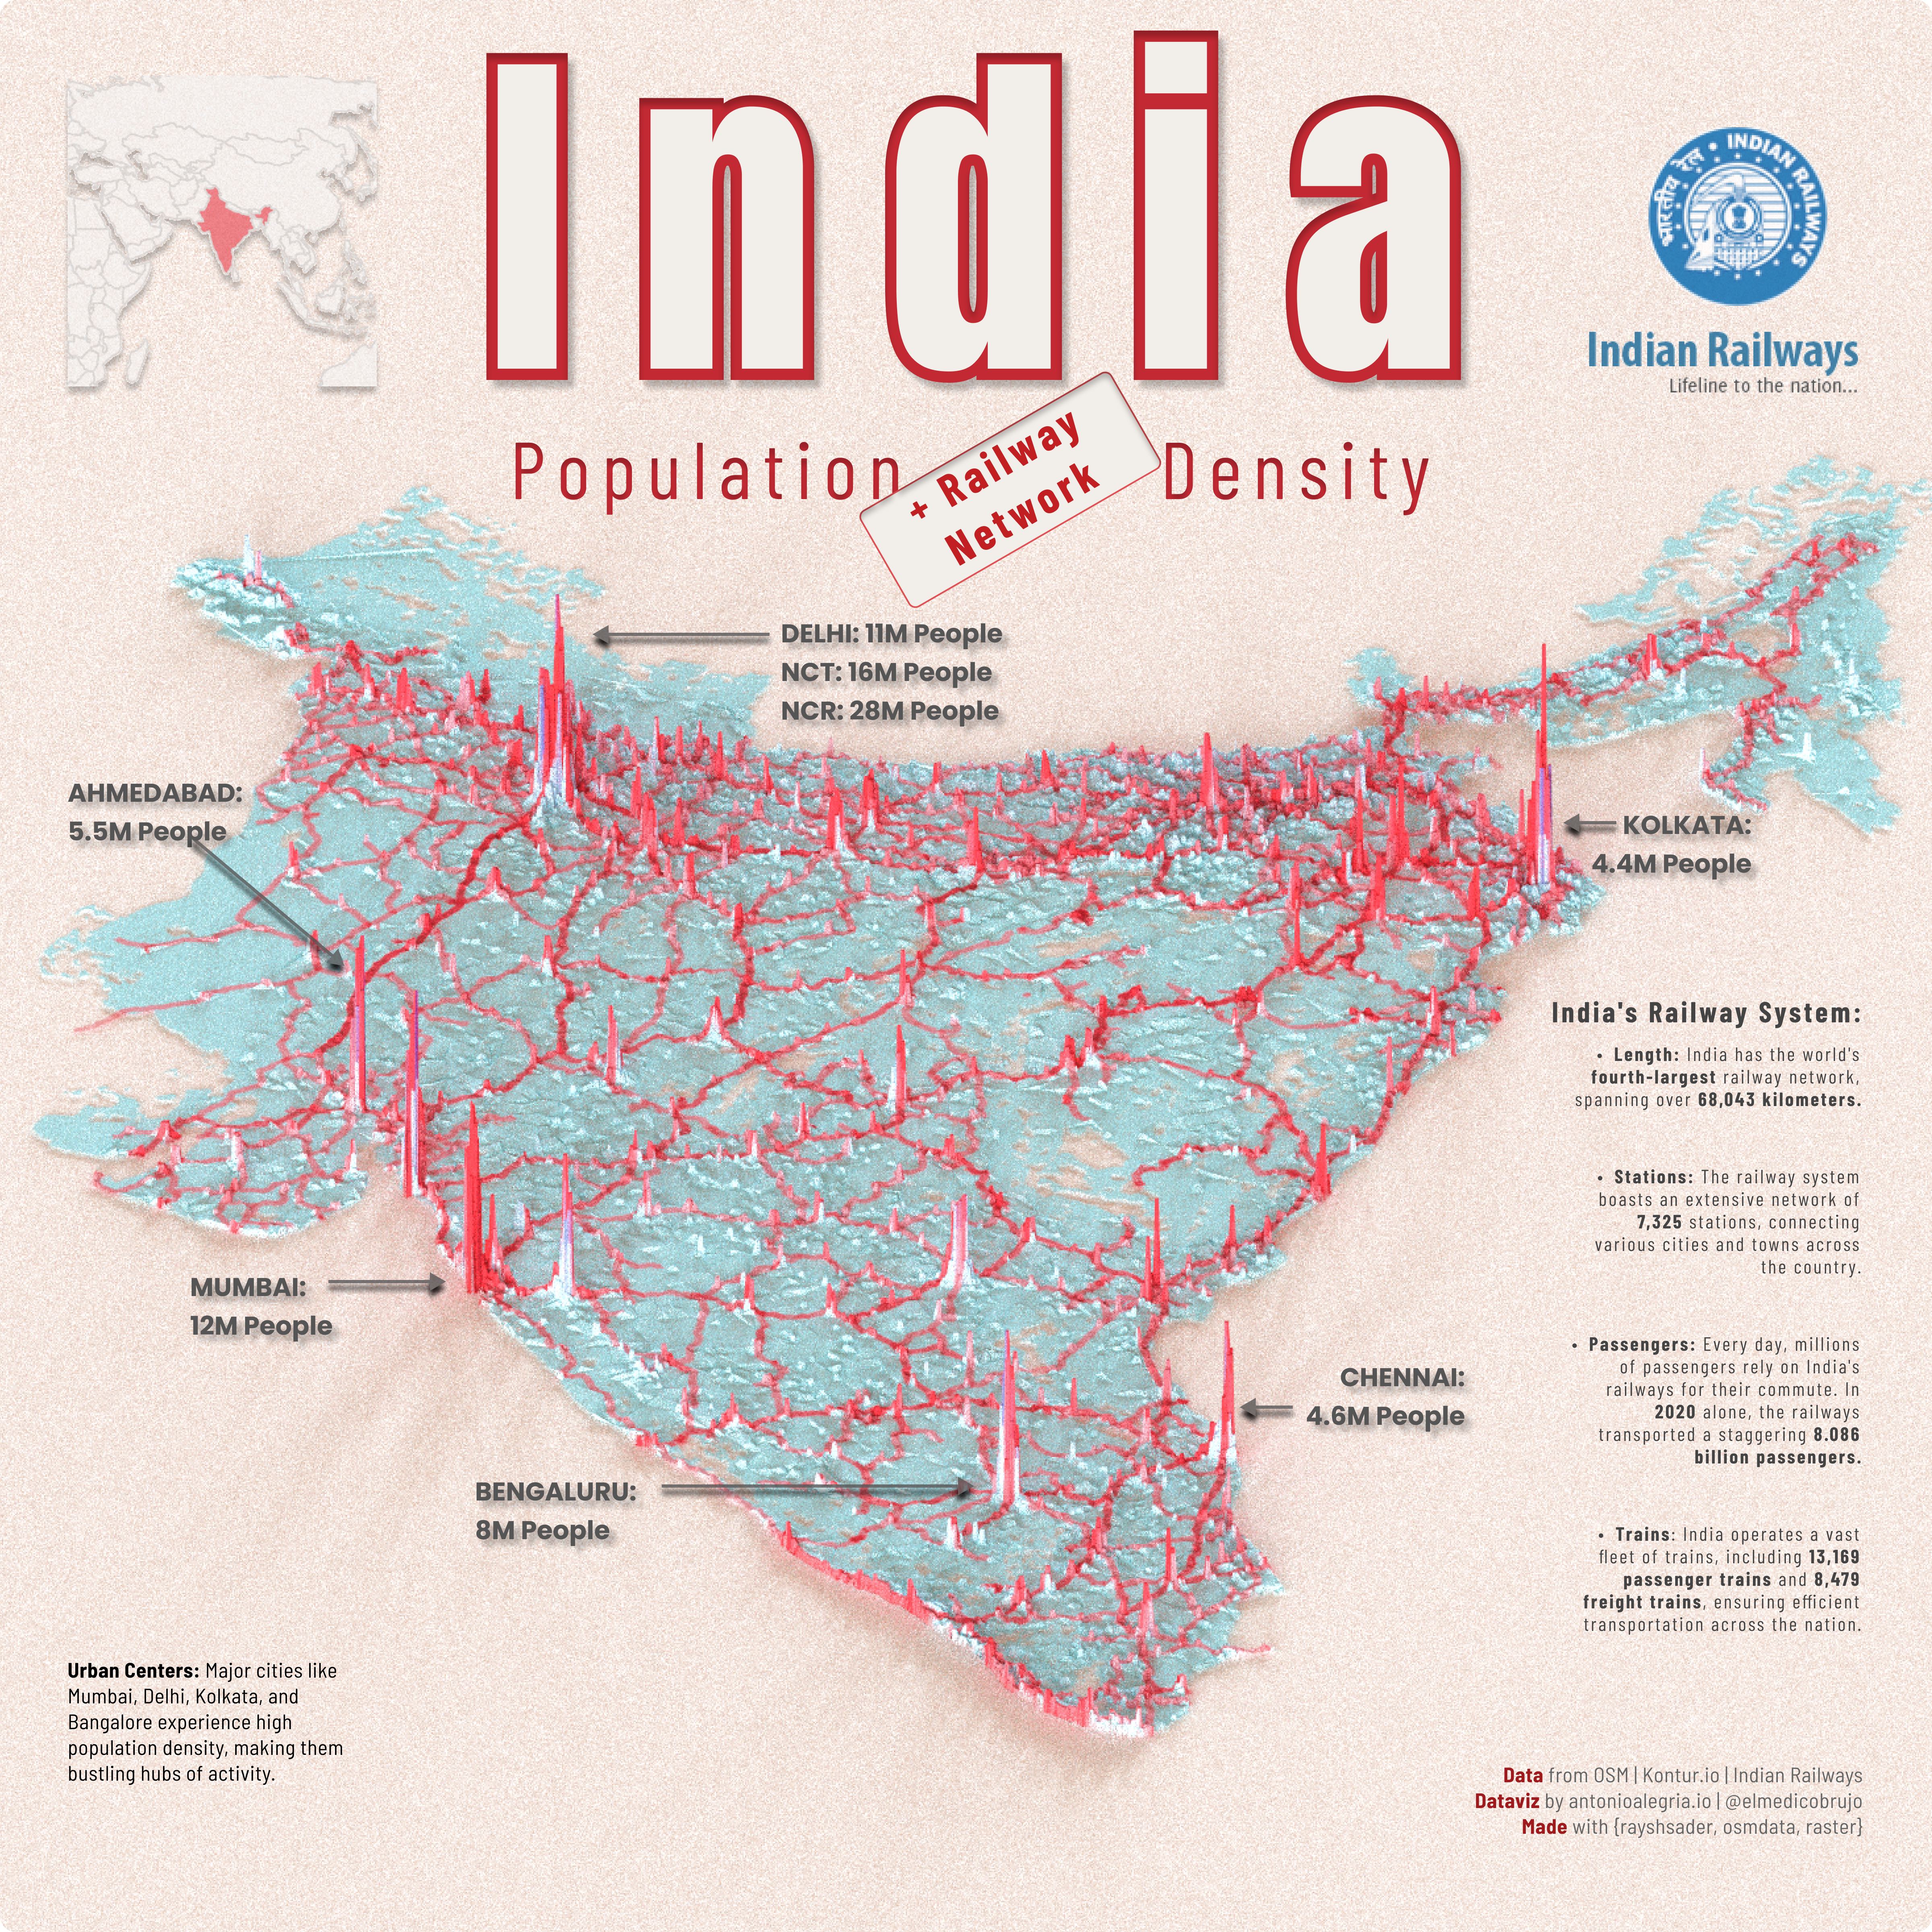
India Railway System
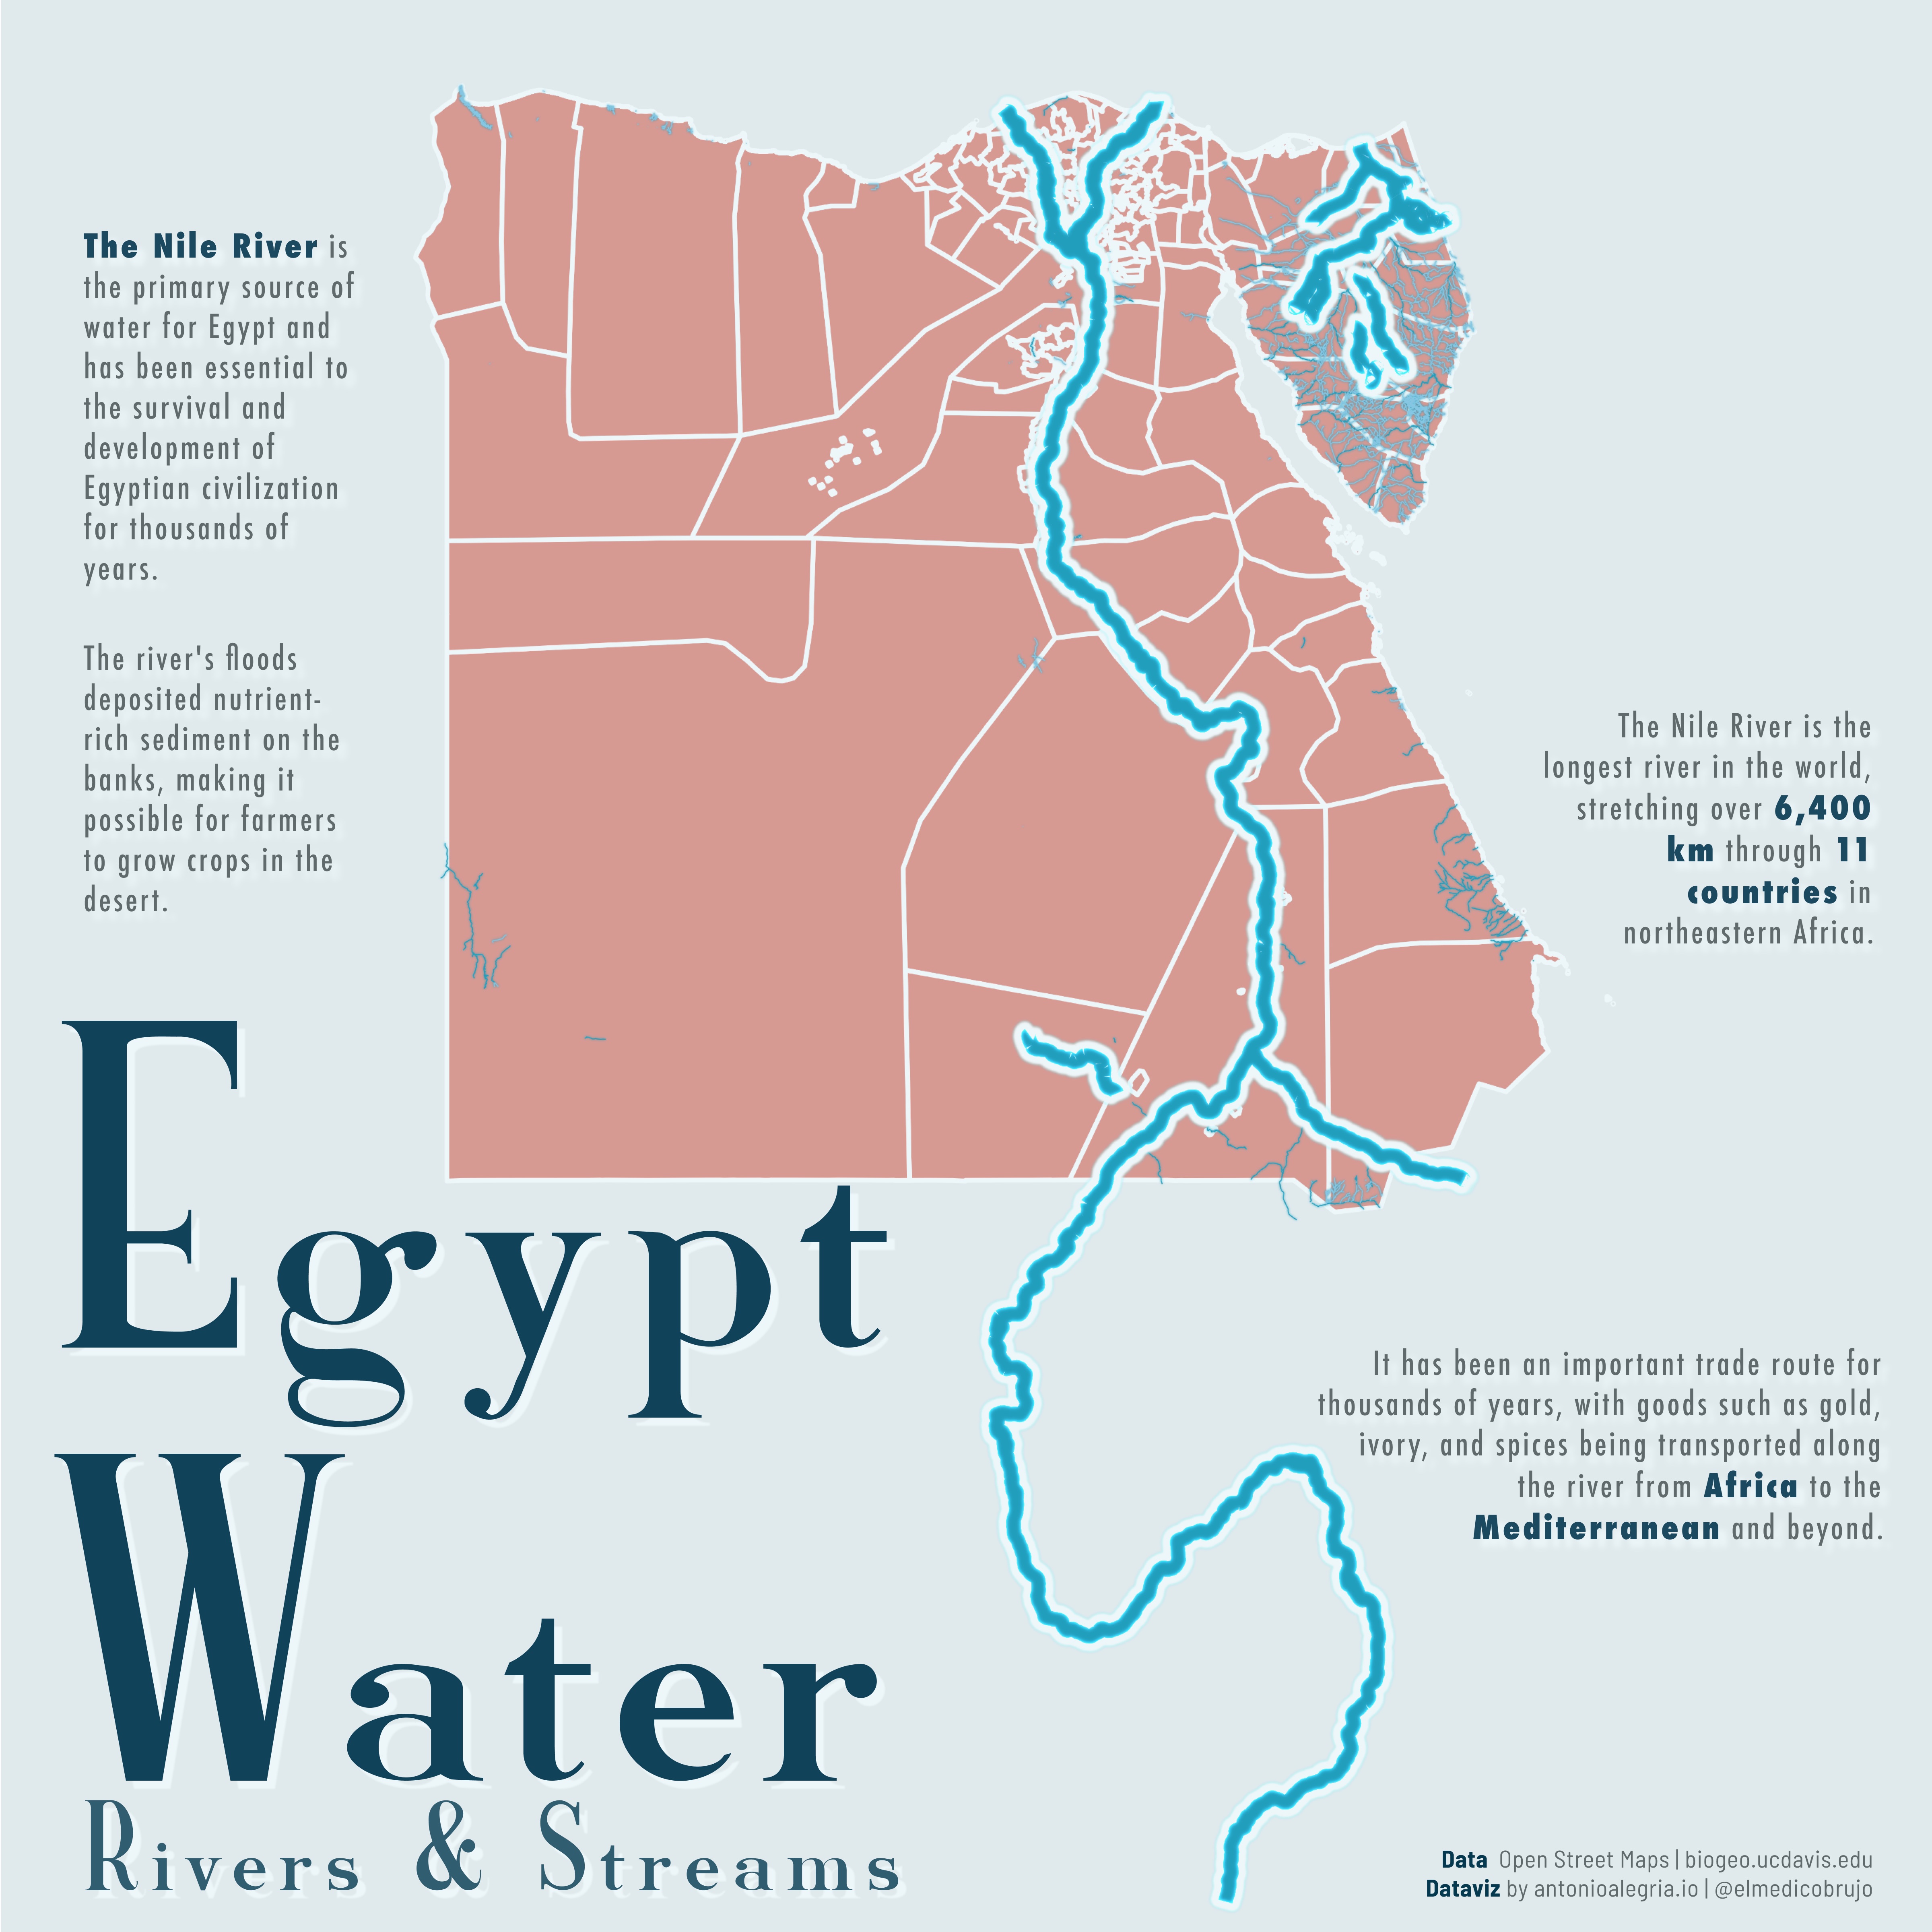
Egypt Water

México Healthcare
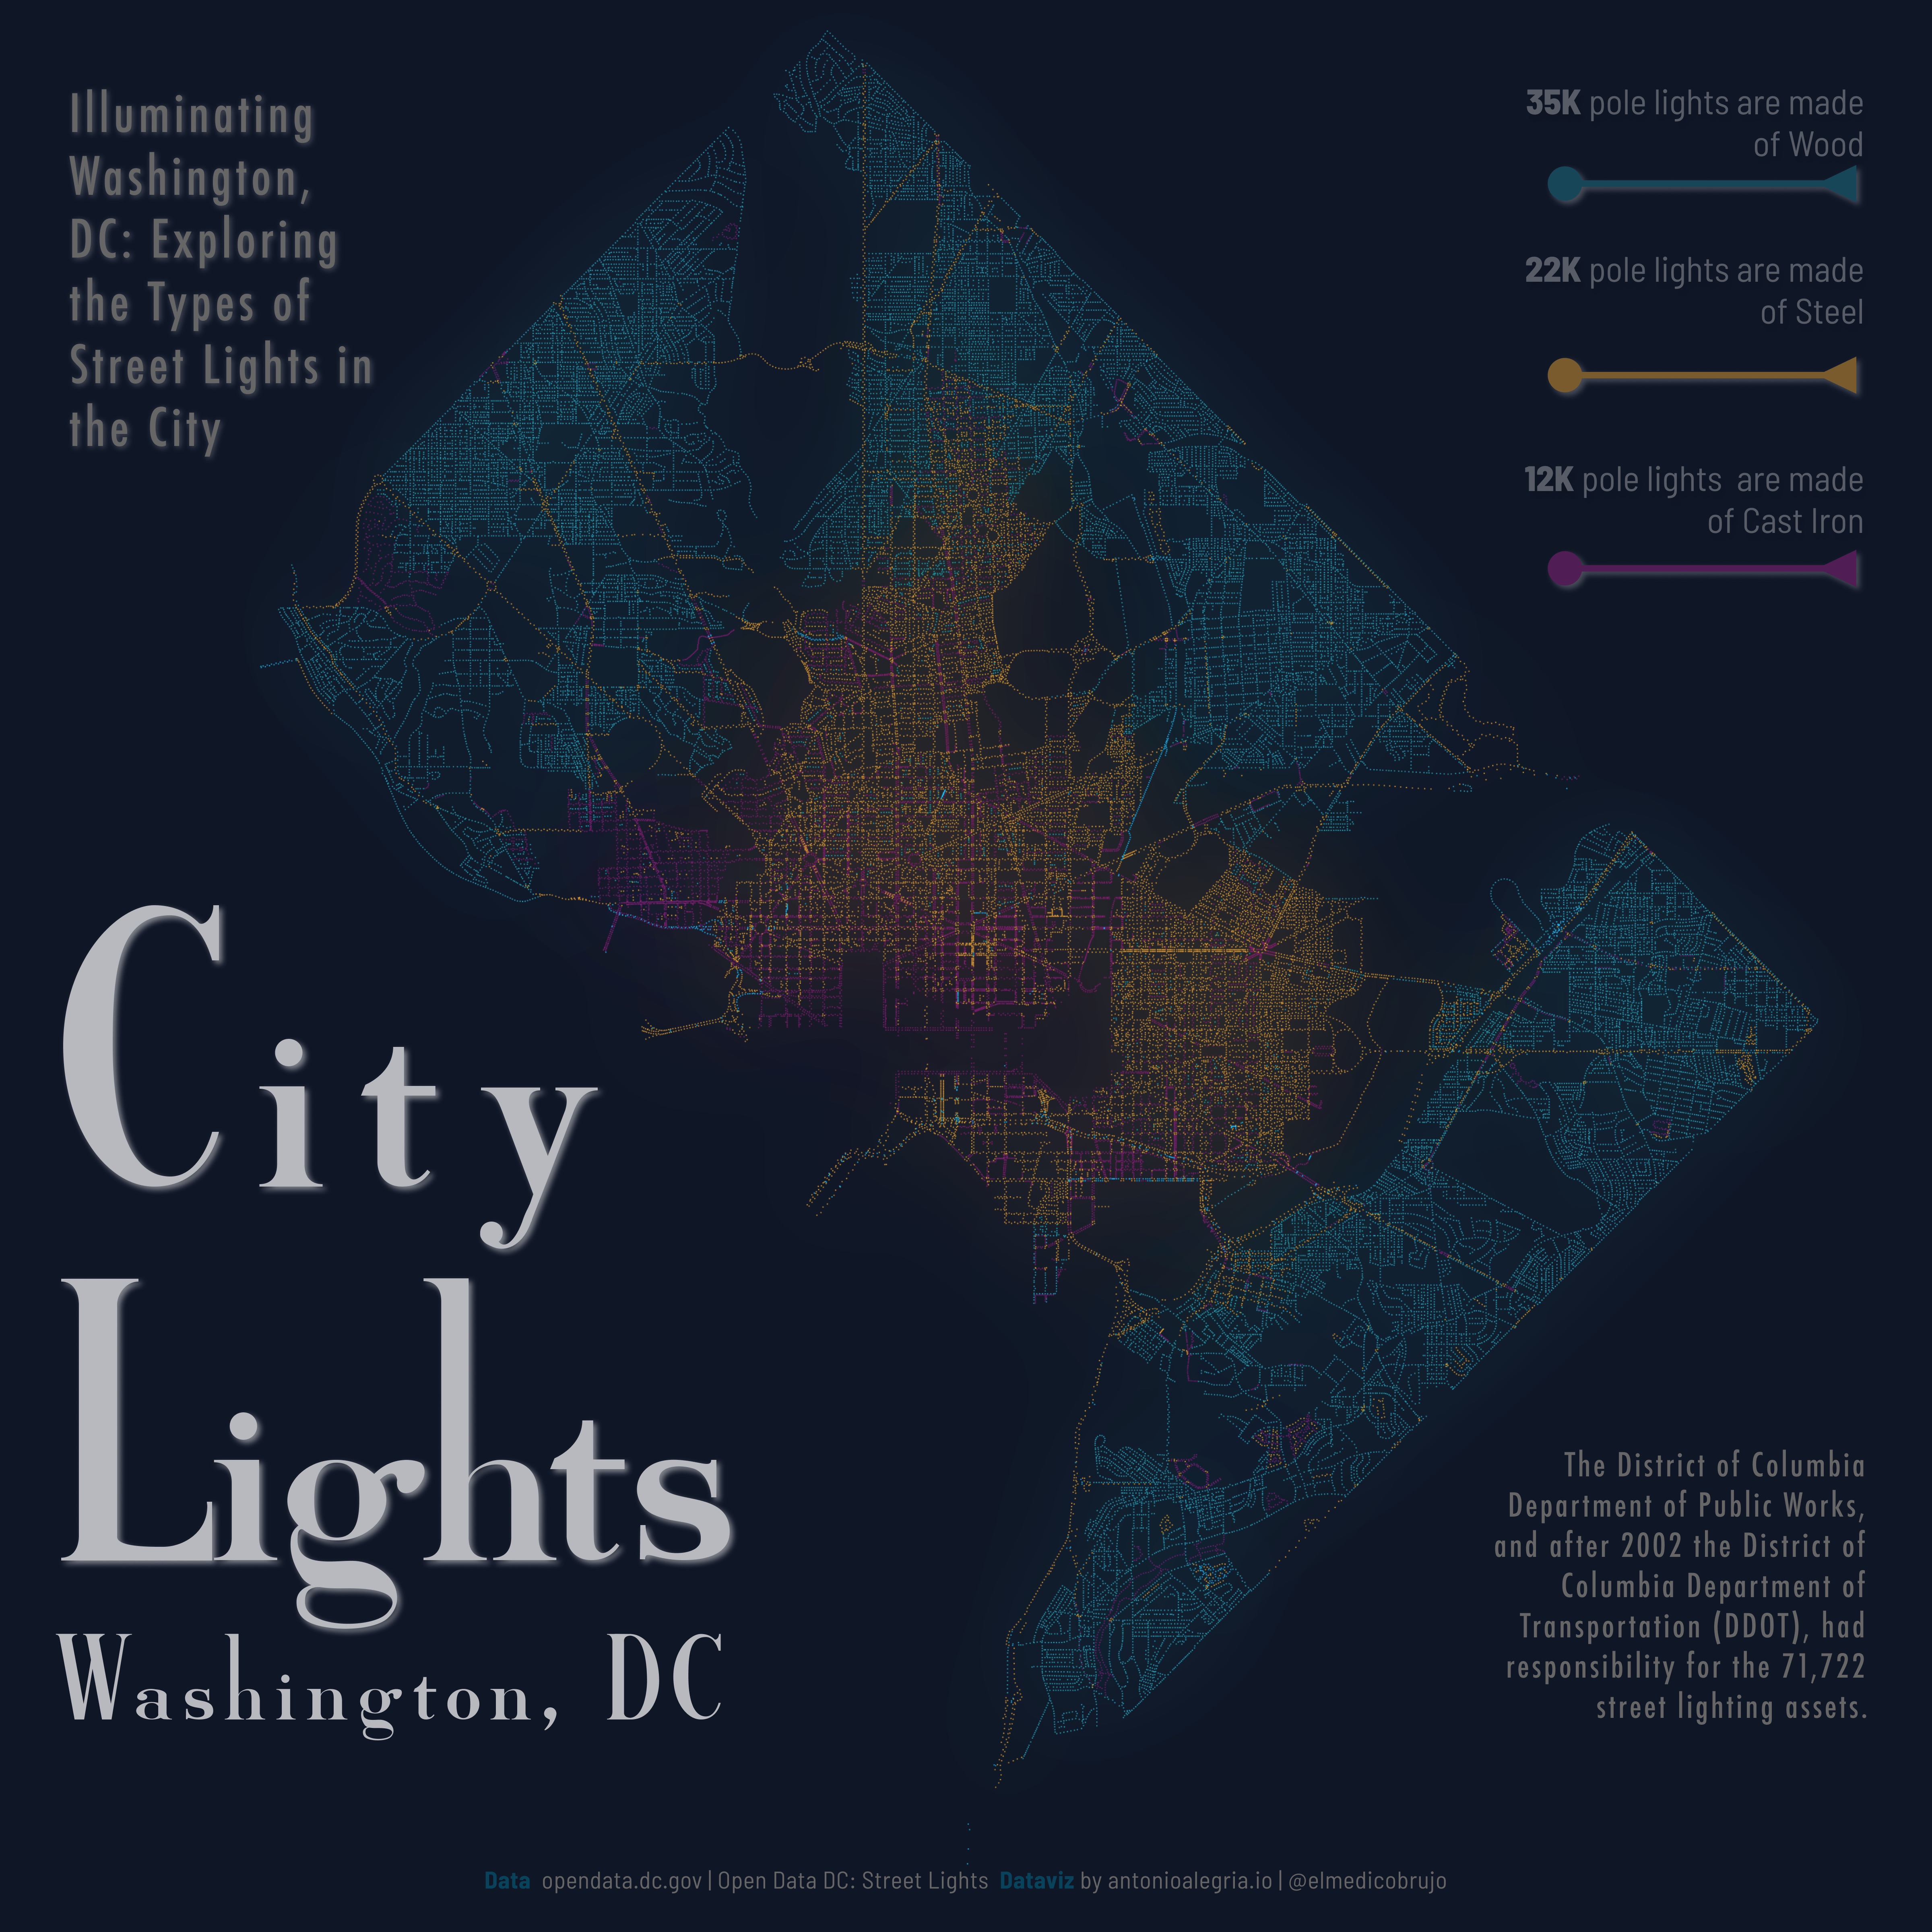
Washington, DC Lights
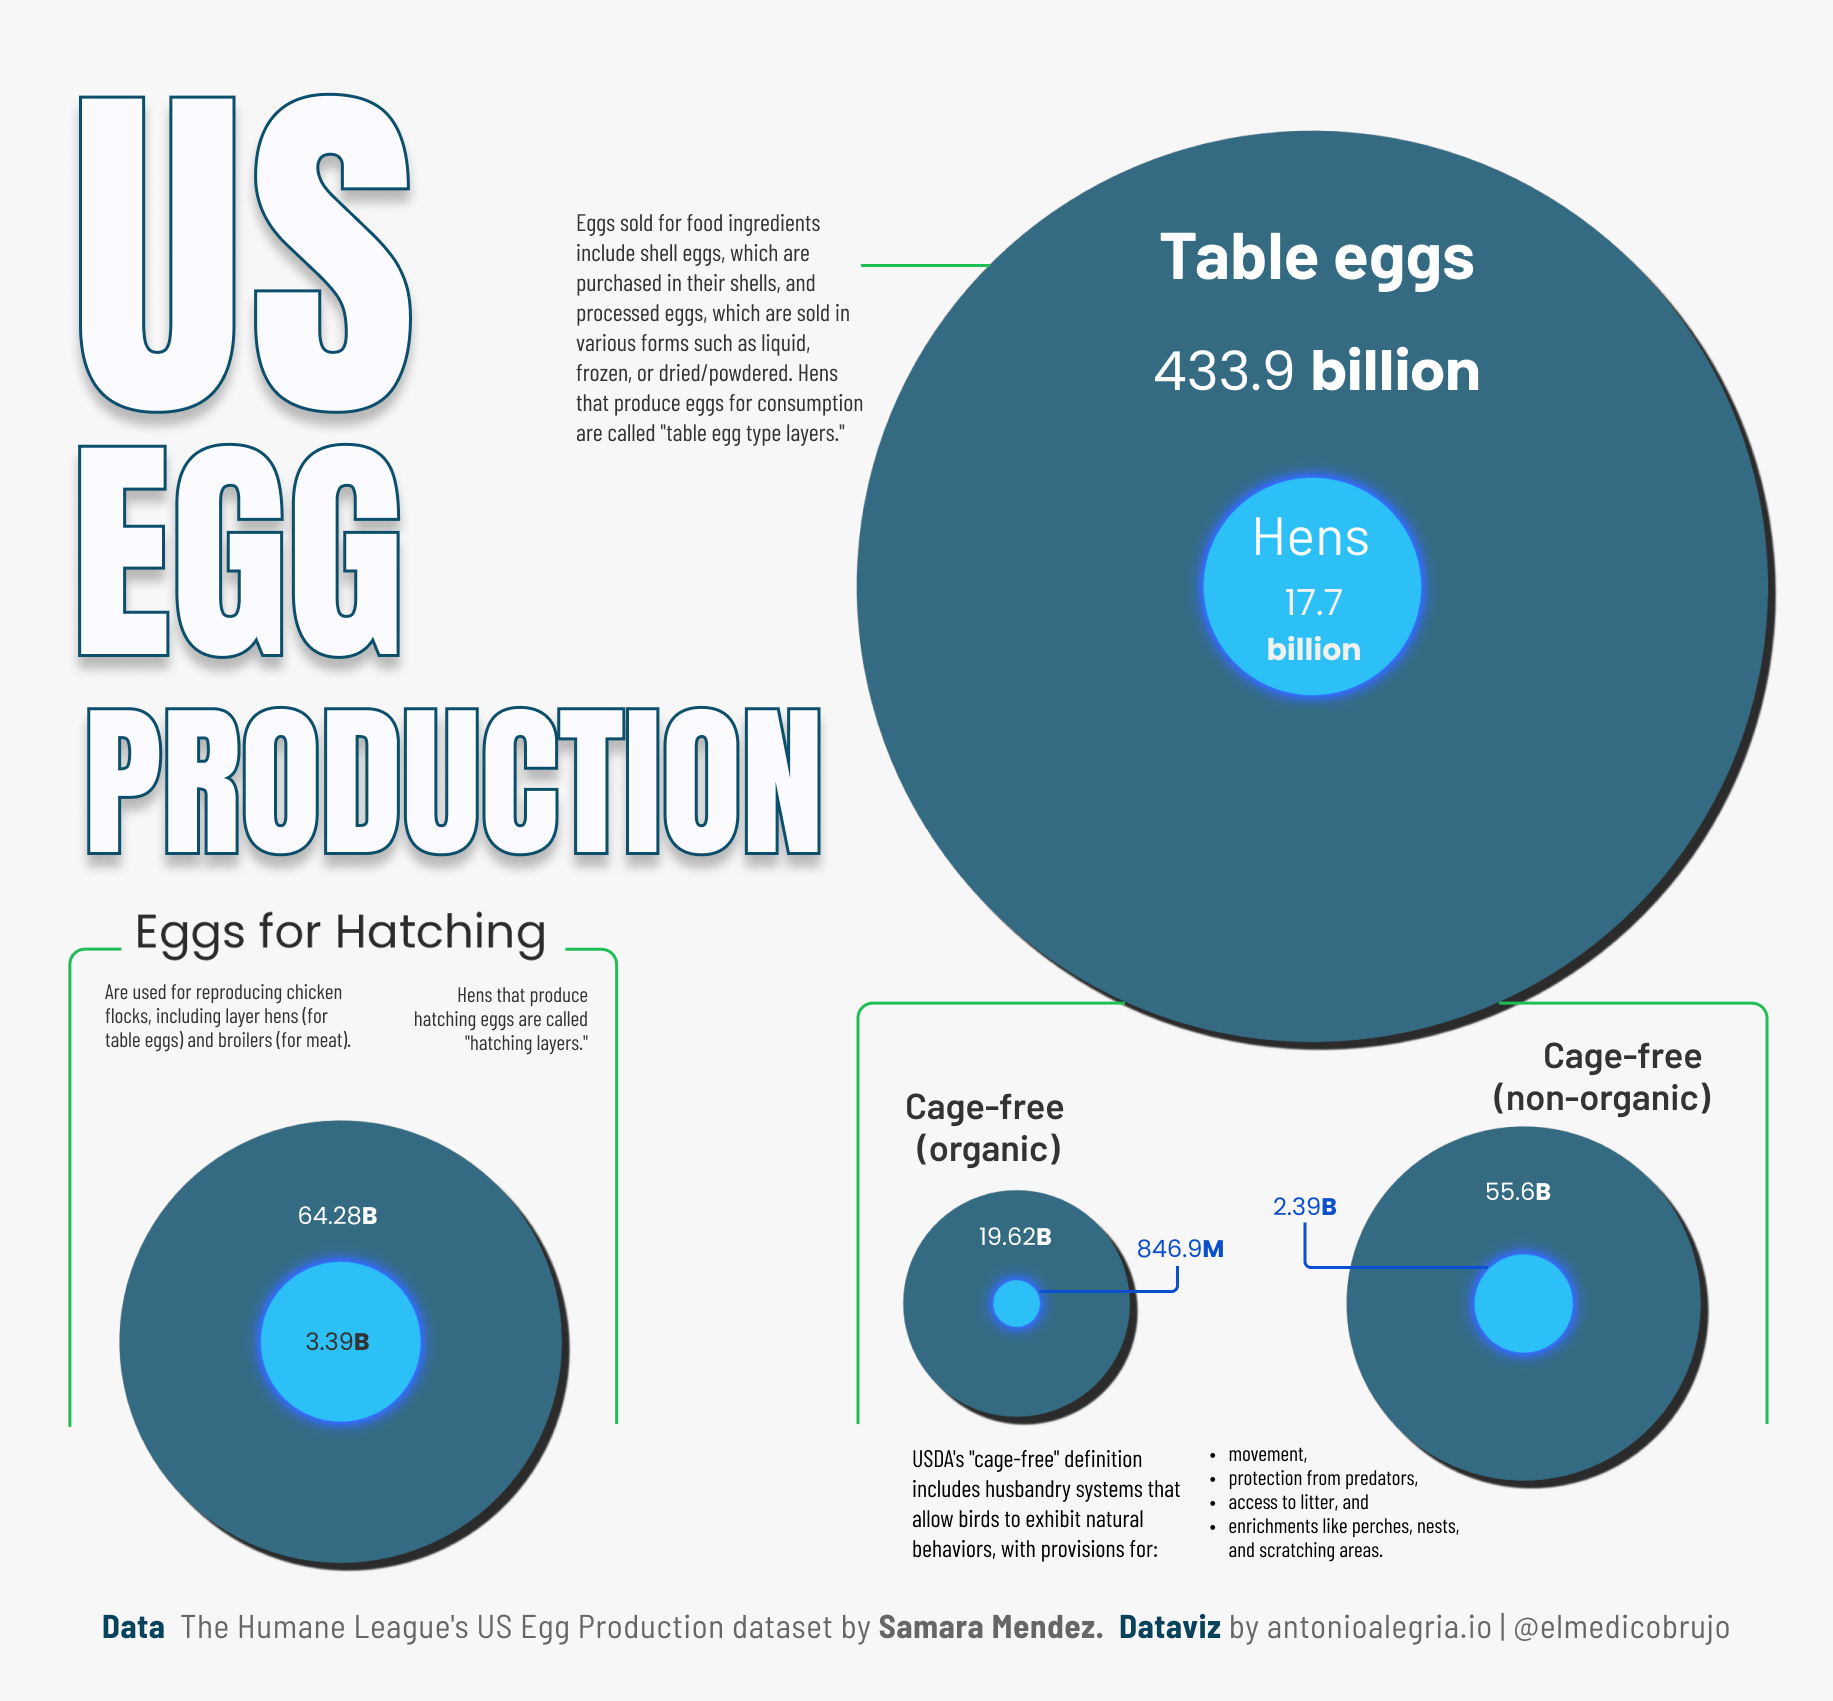
US Eggs Production
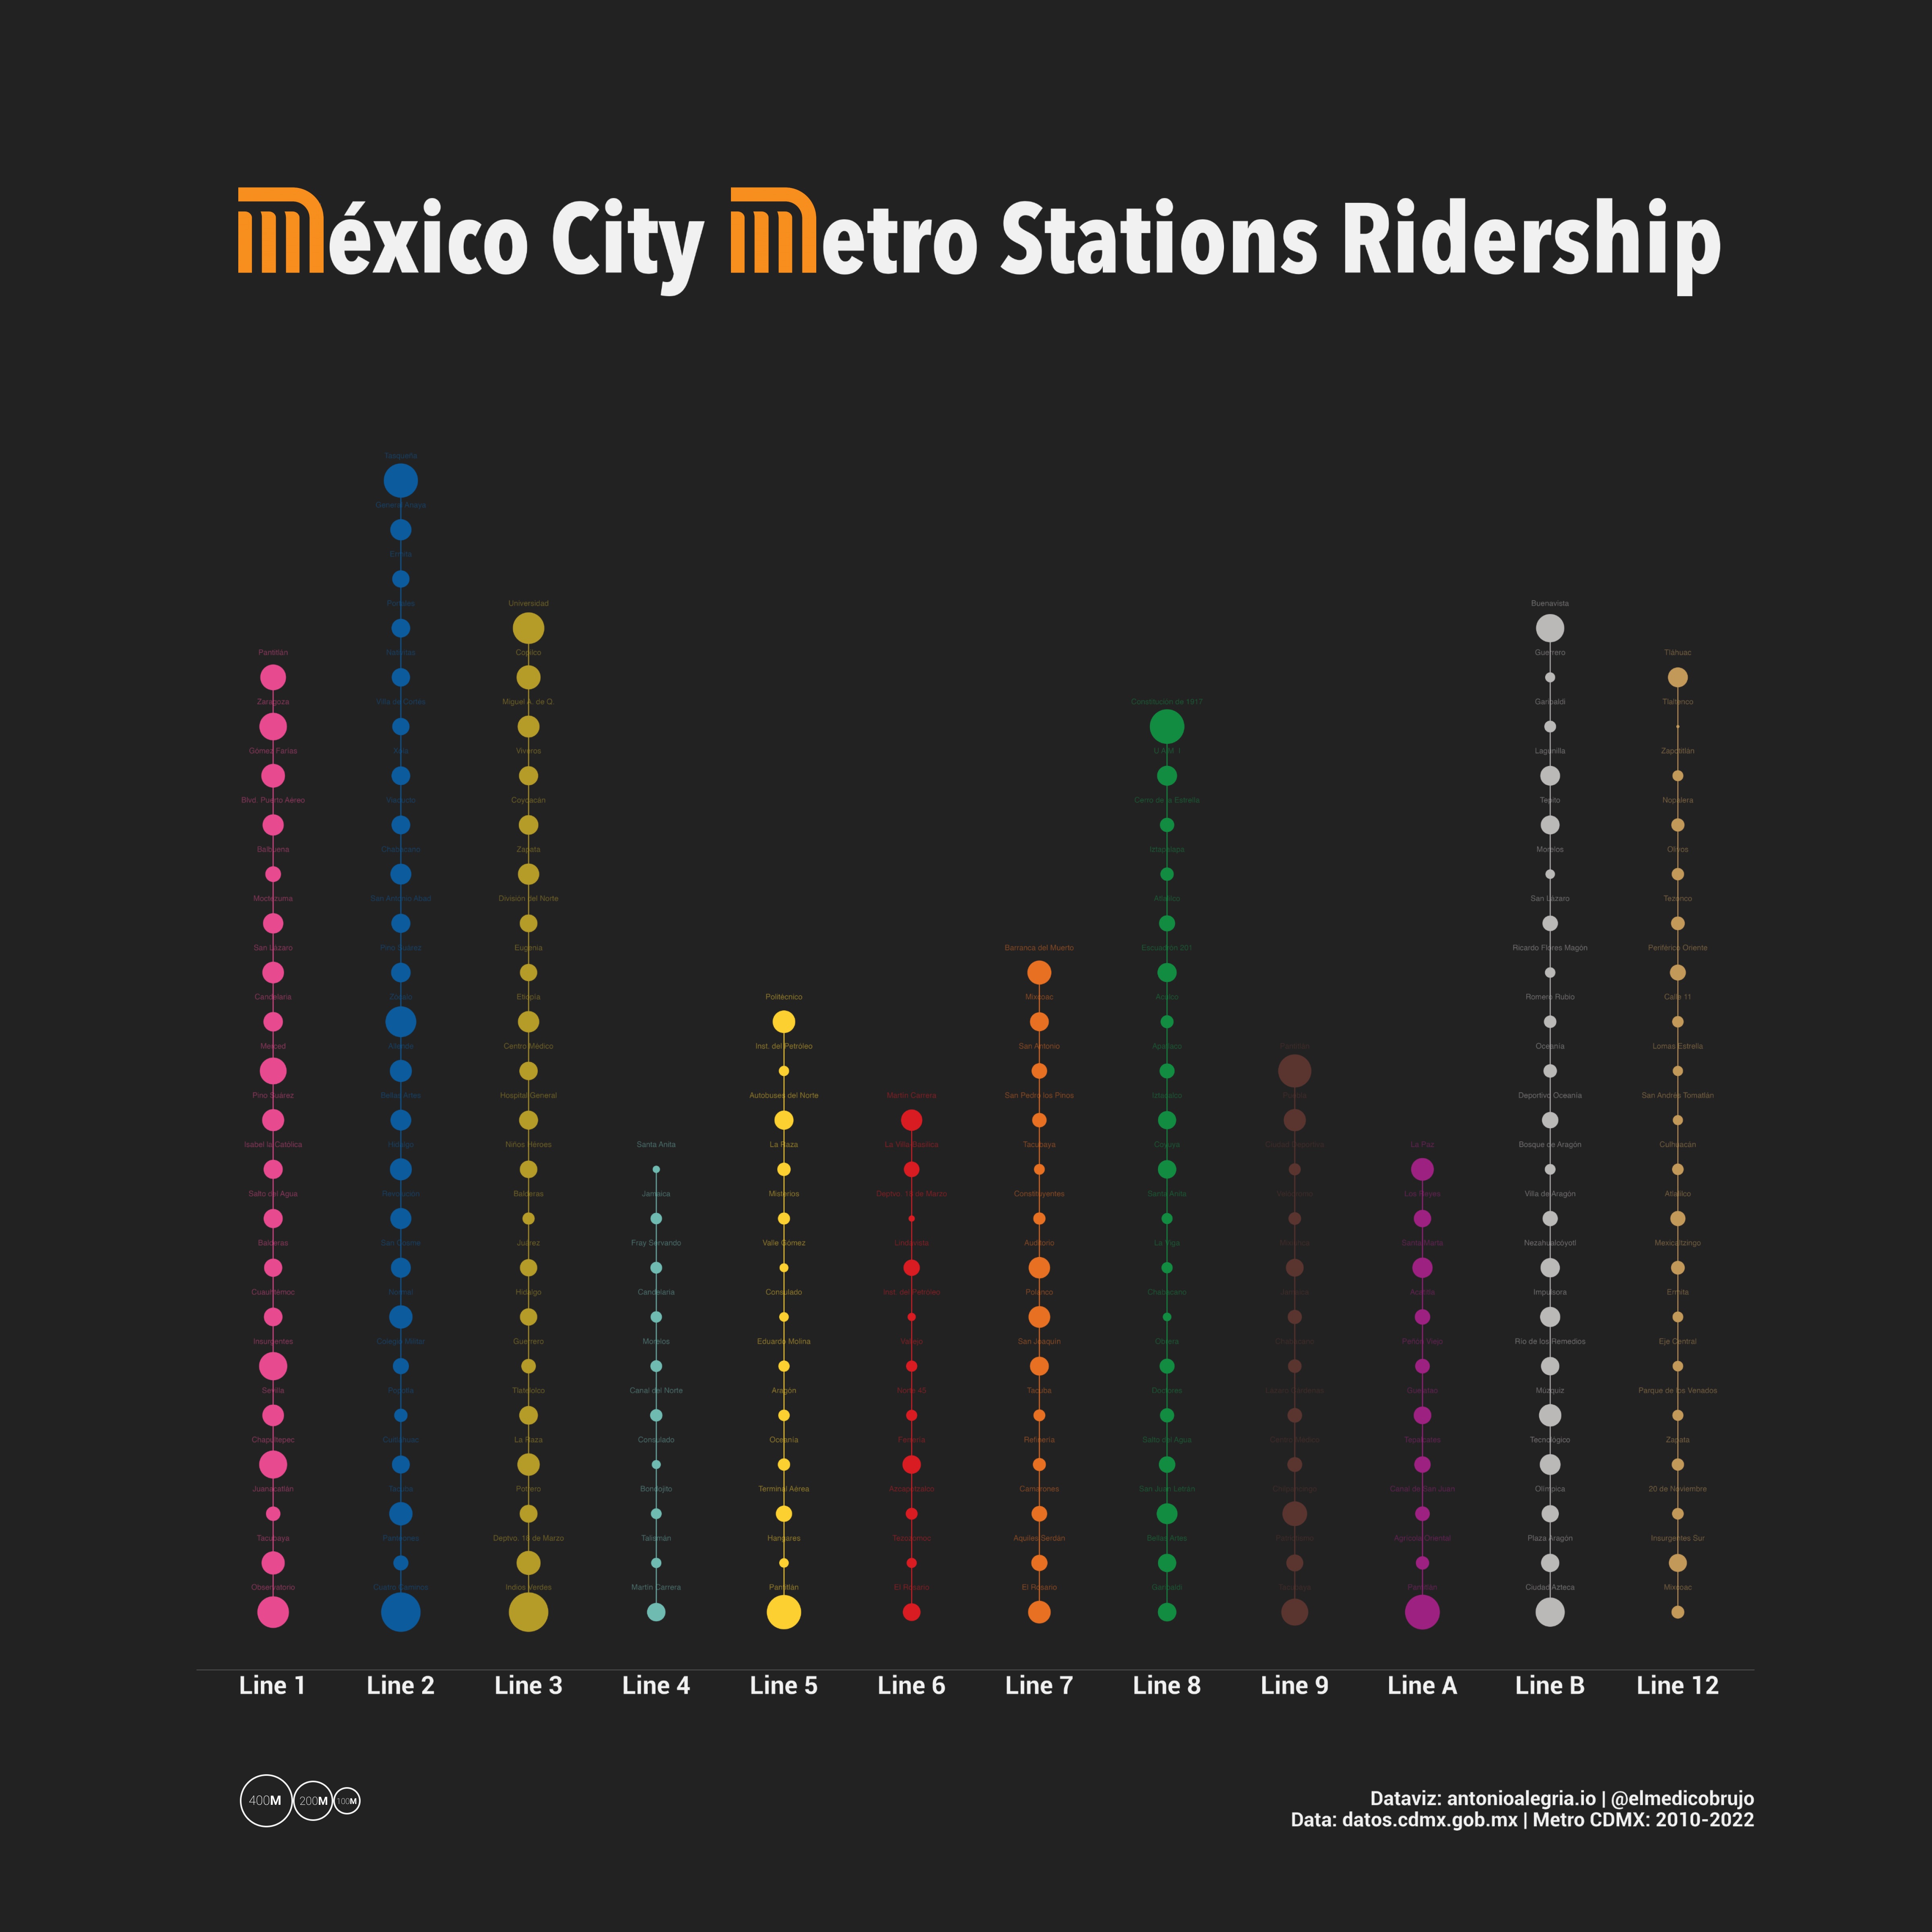
México City Metro Ridership
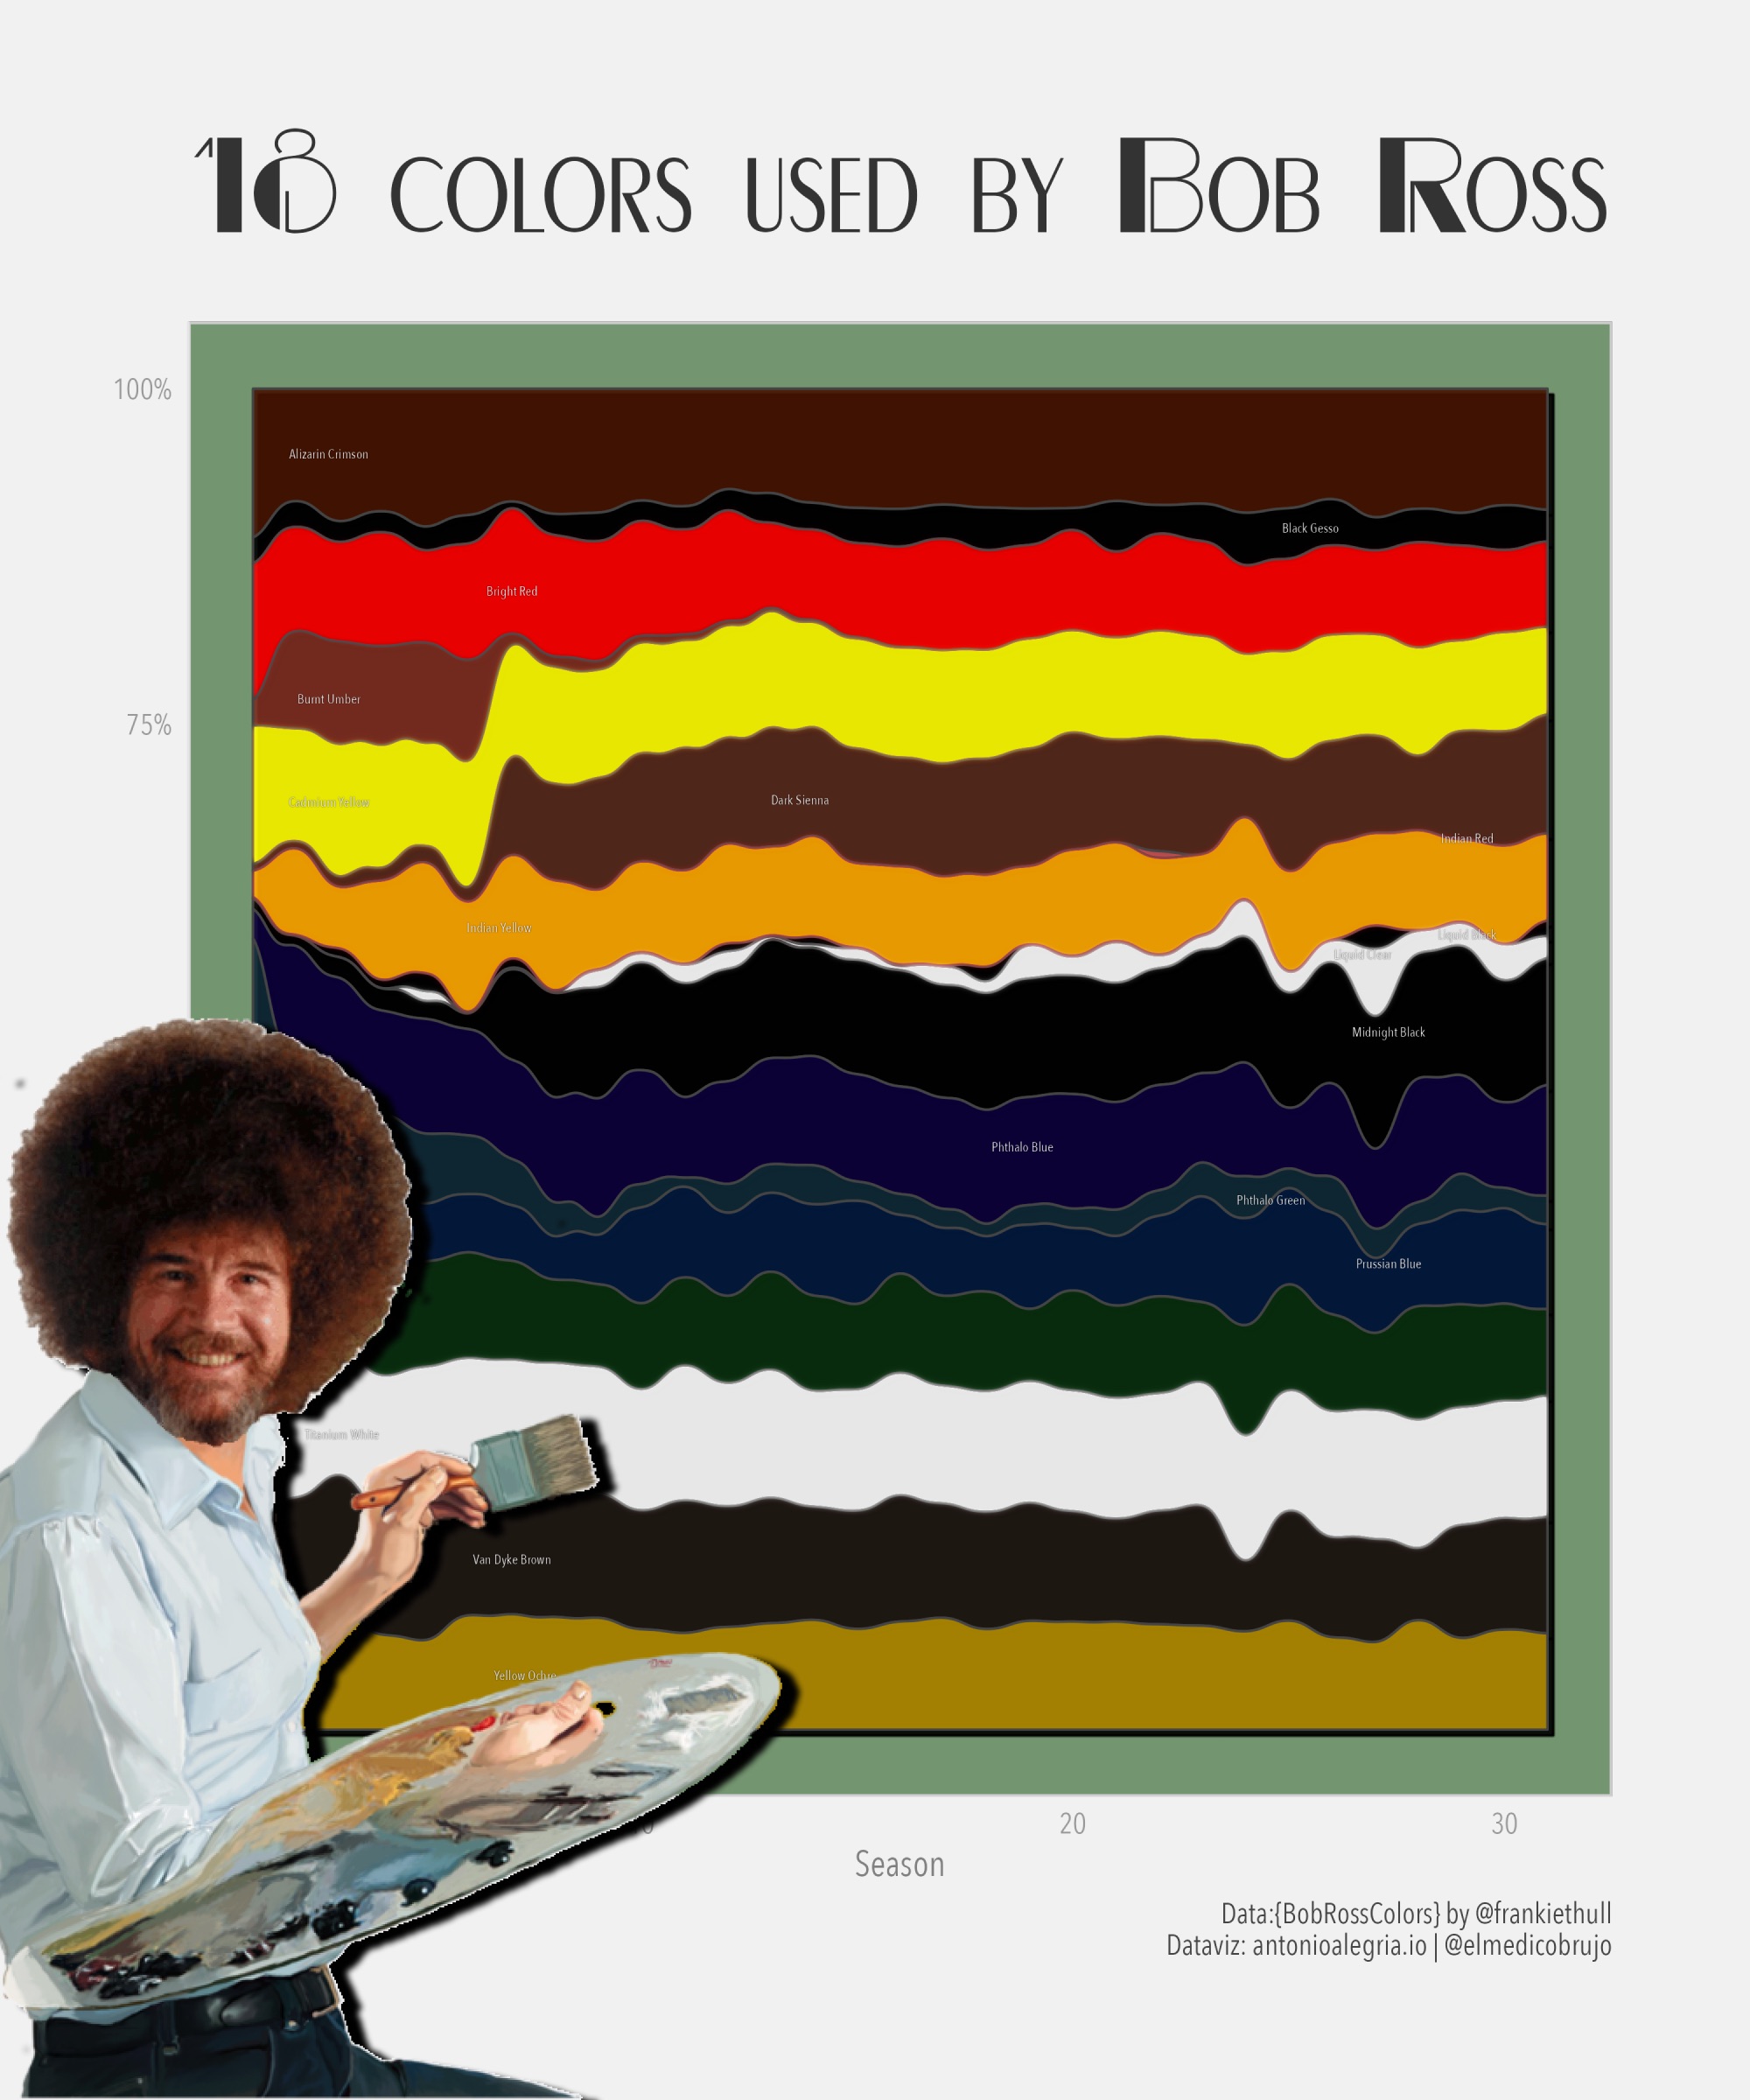
Colors Used By Bob Ross
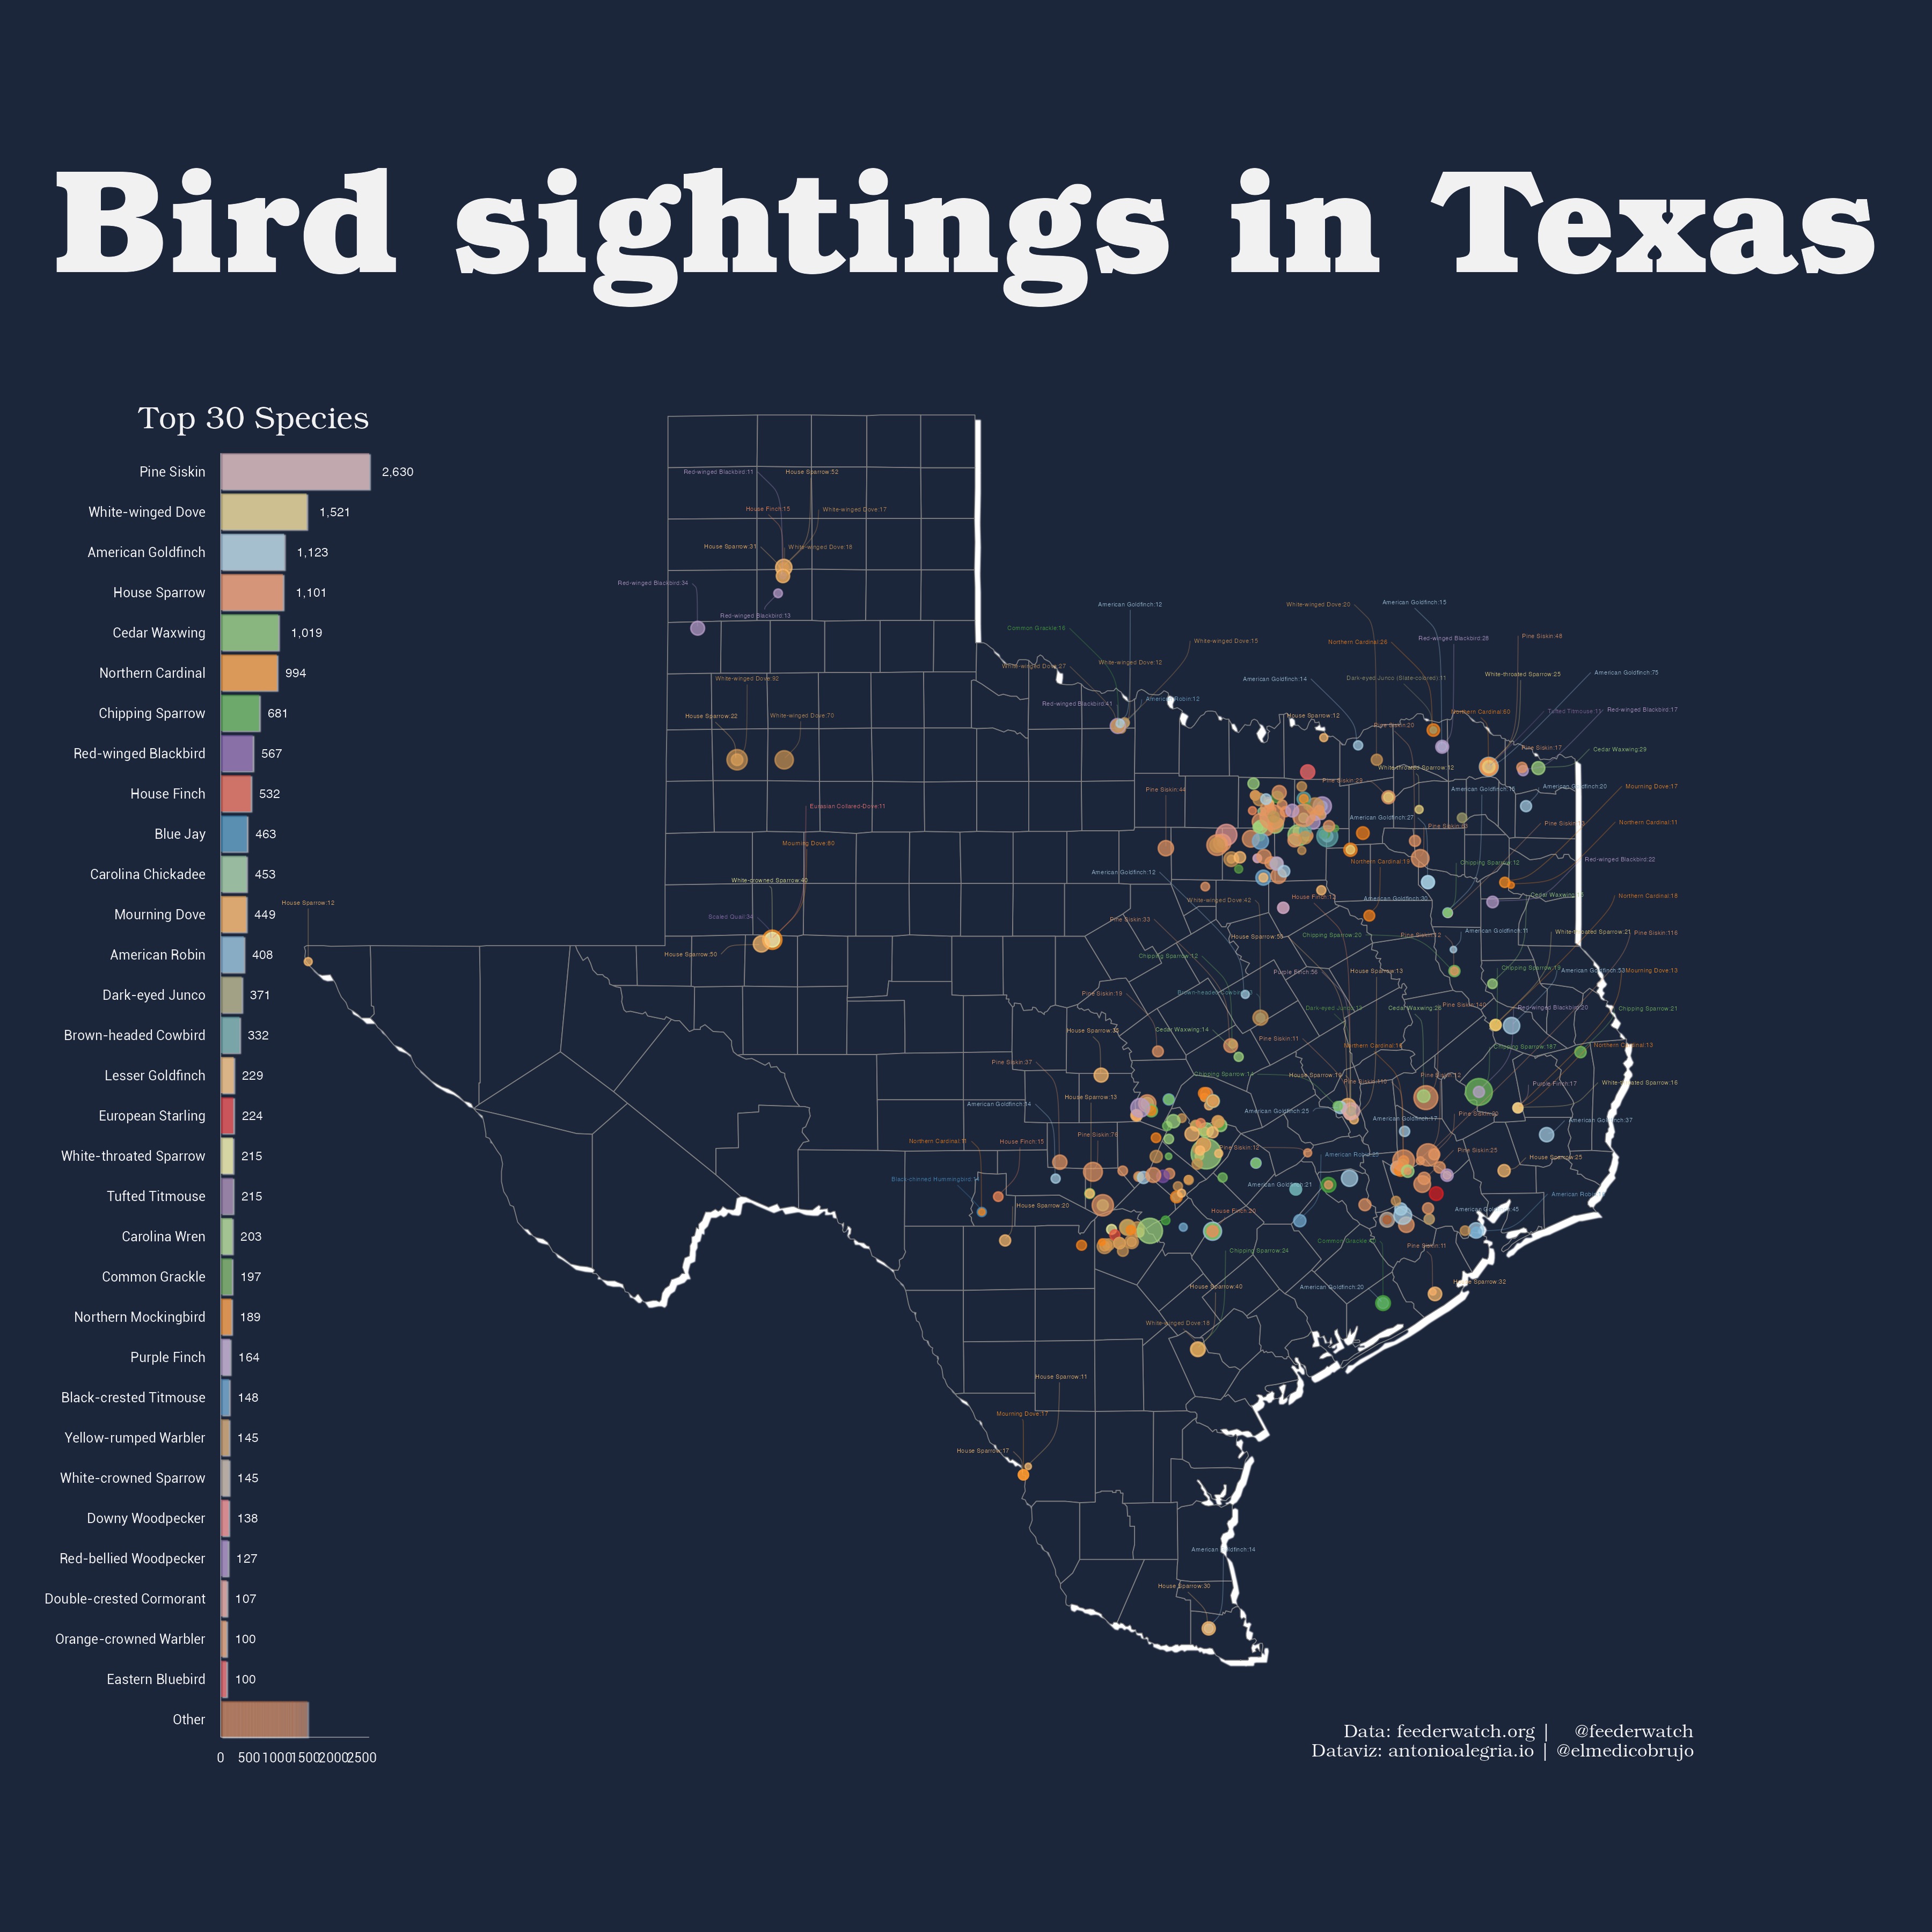
Bird sightings in texas. Top 30 Species
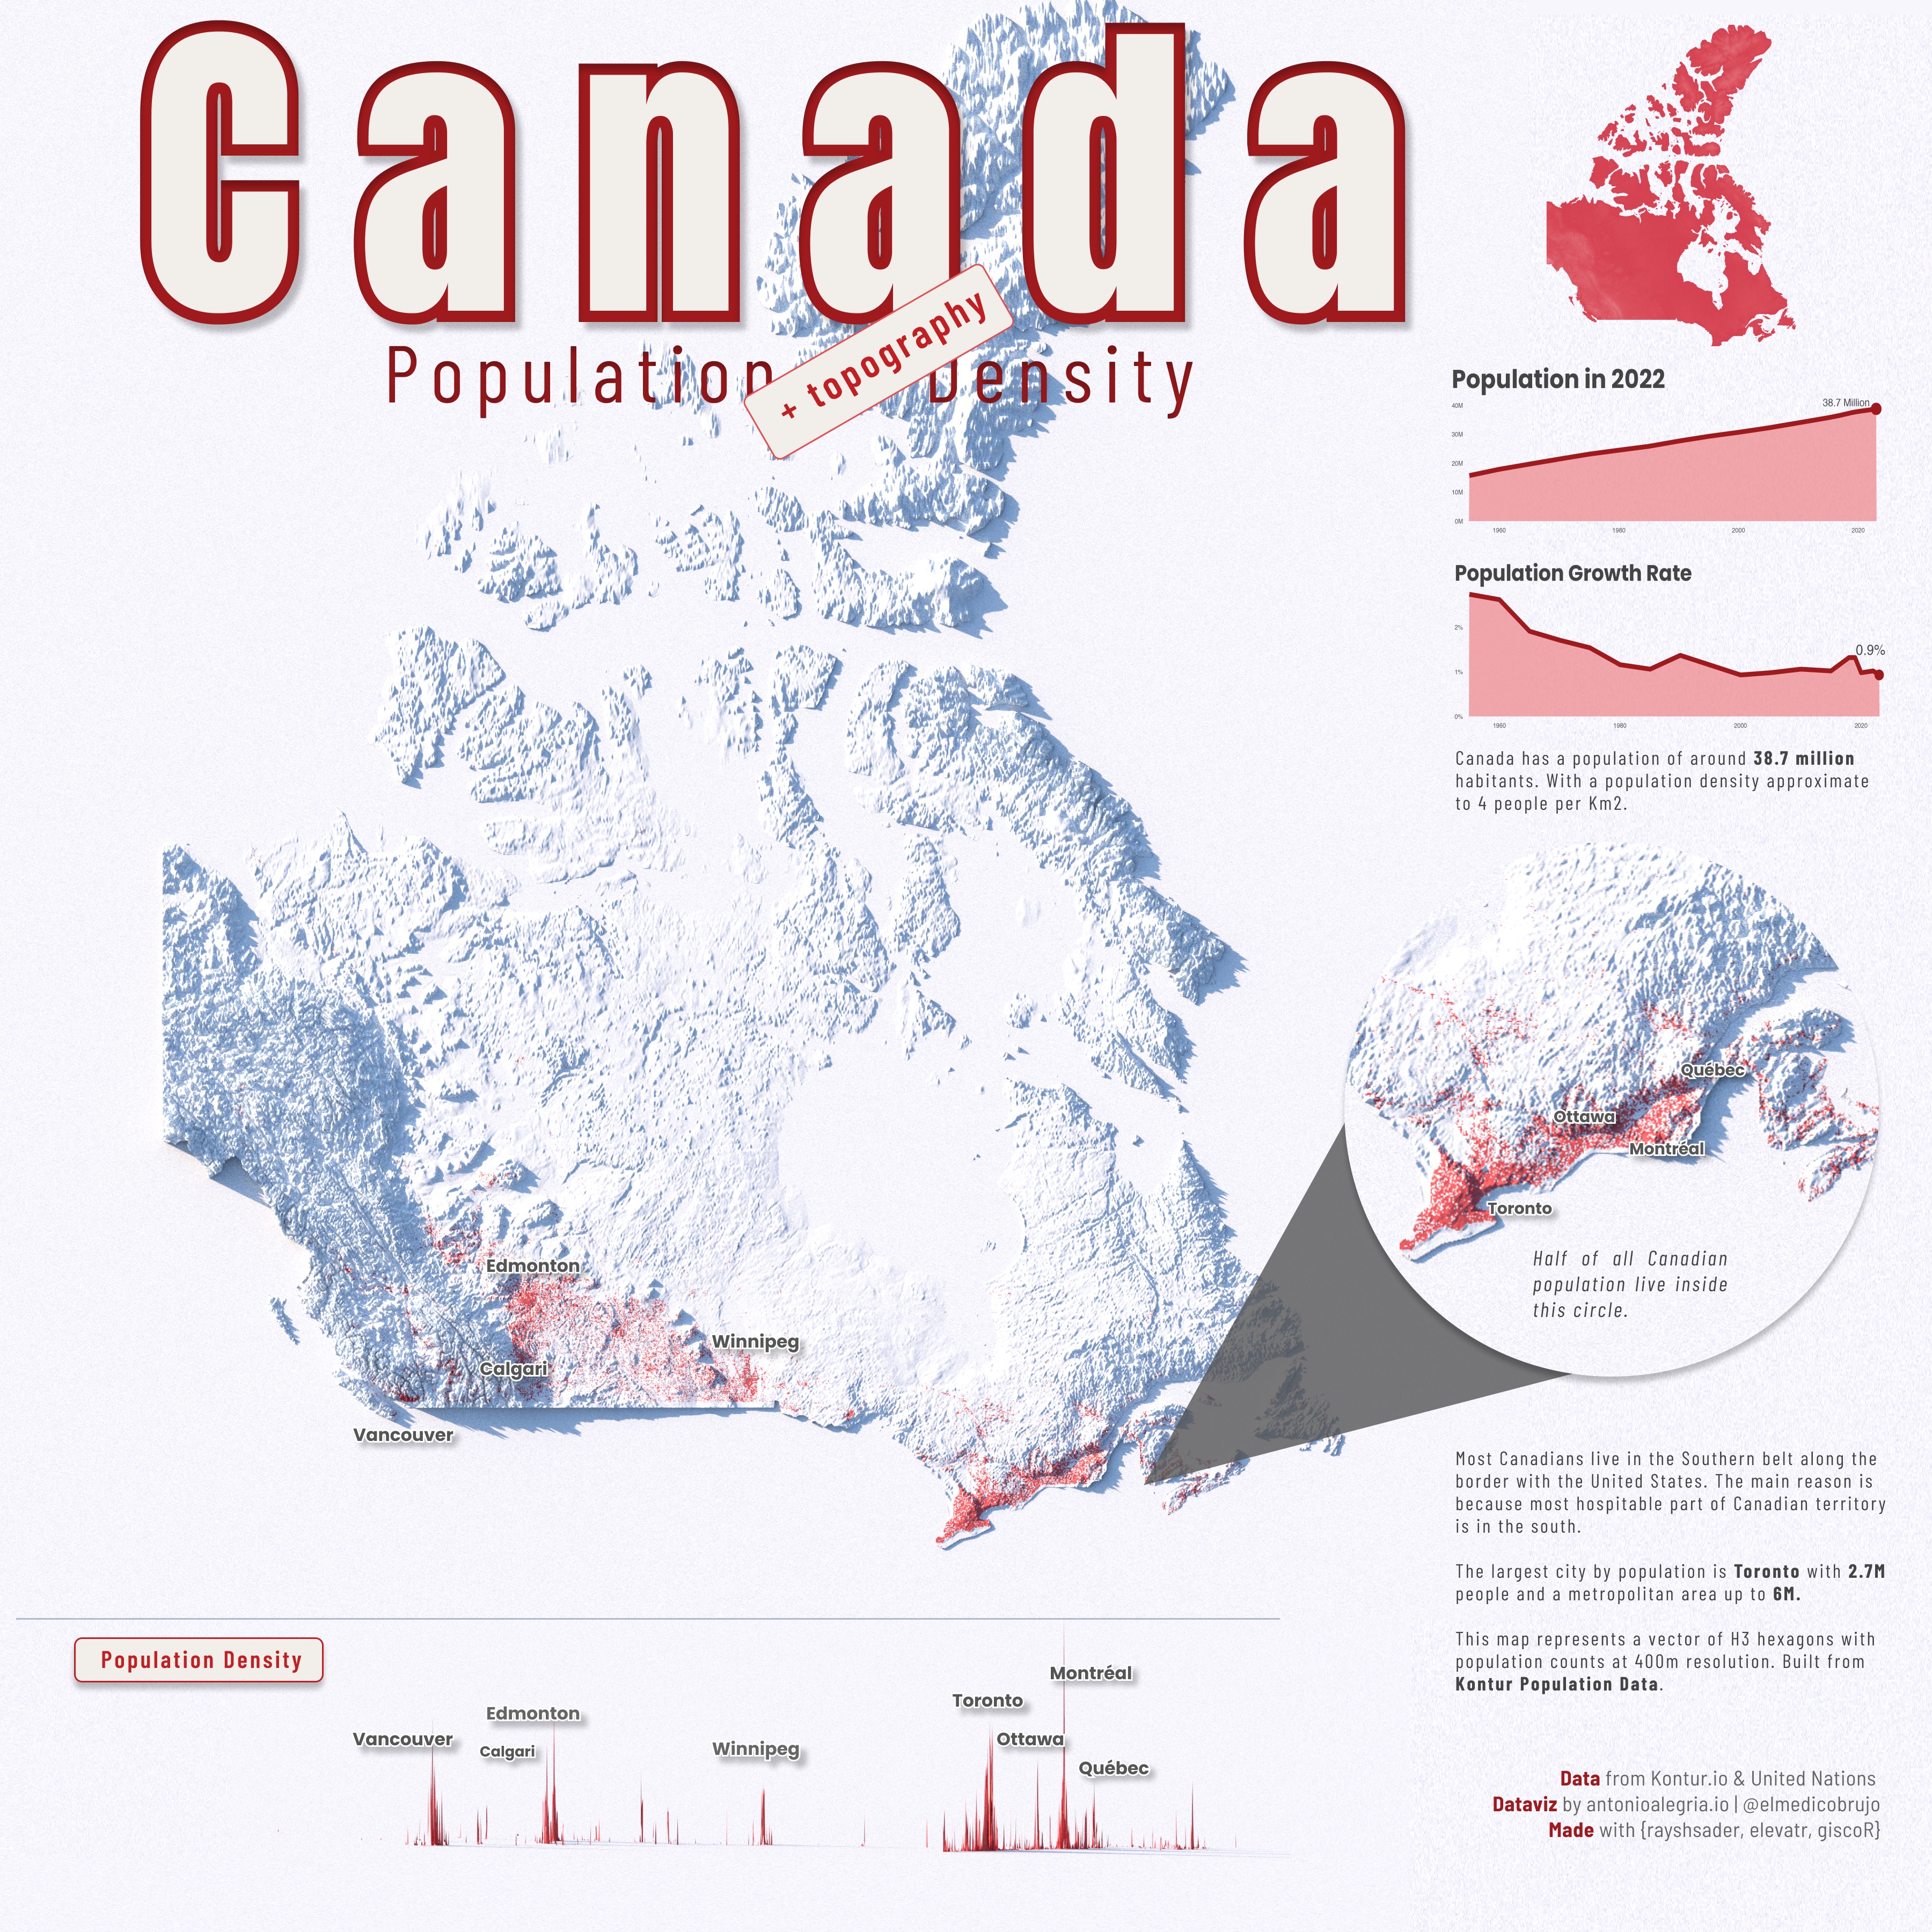
Canada Population Density and Topography

Retail Sales: Health Care | Tiles

Retail Sales: Health Care | Area
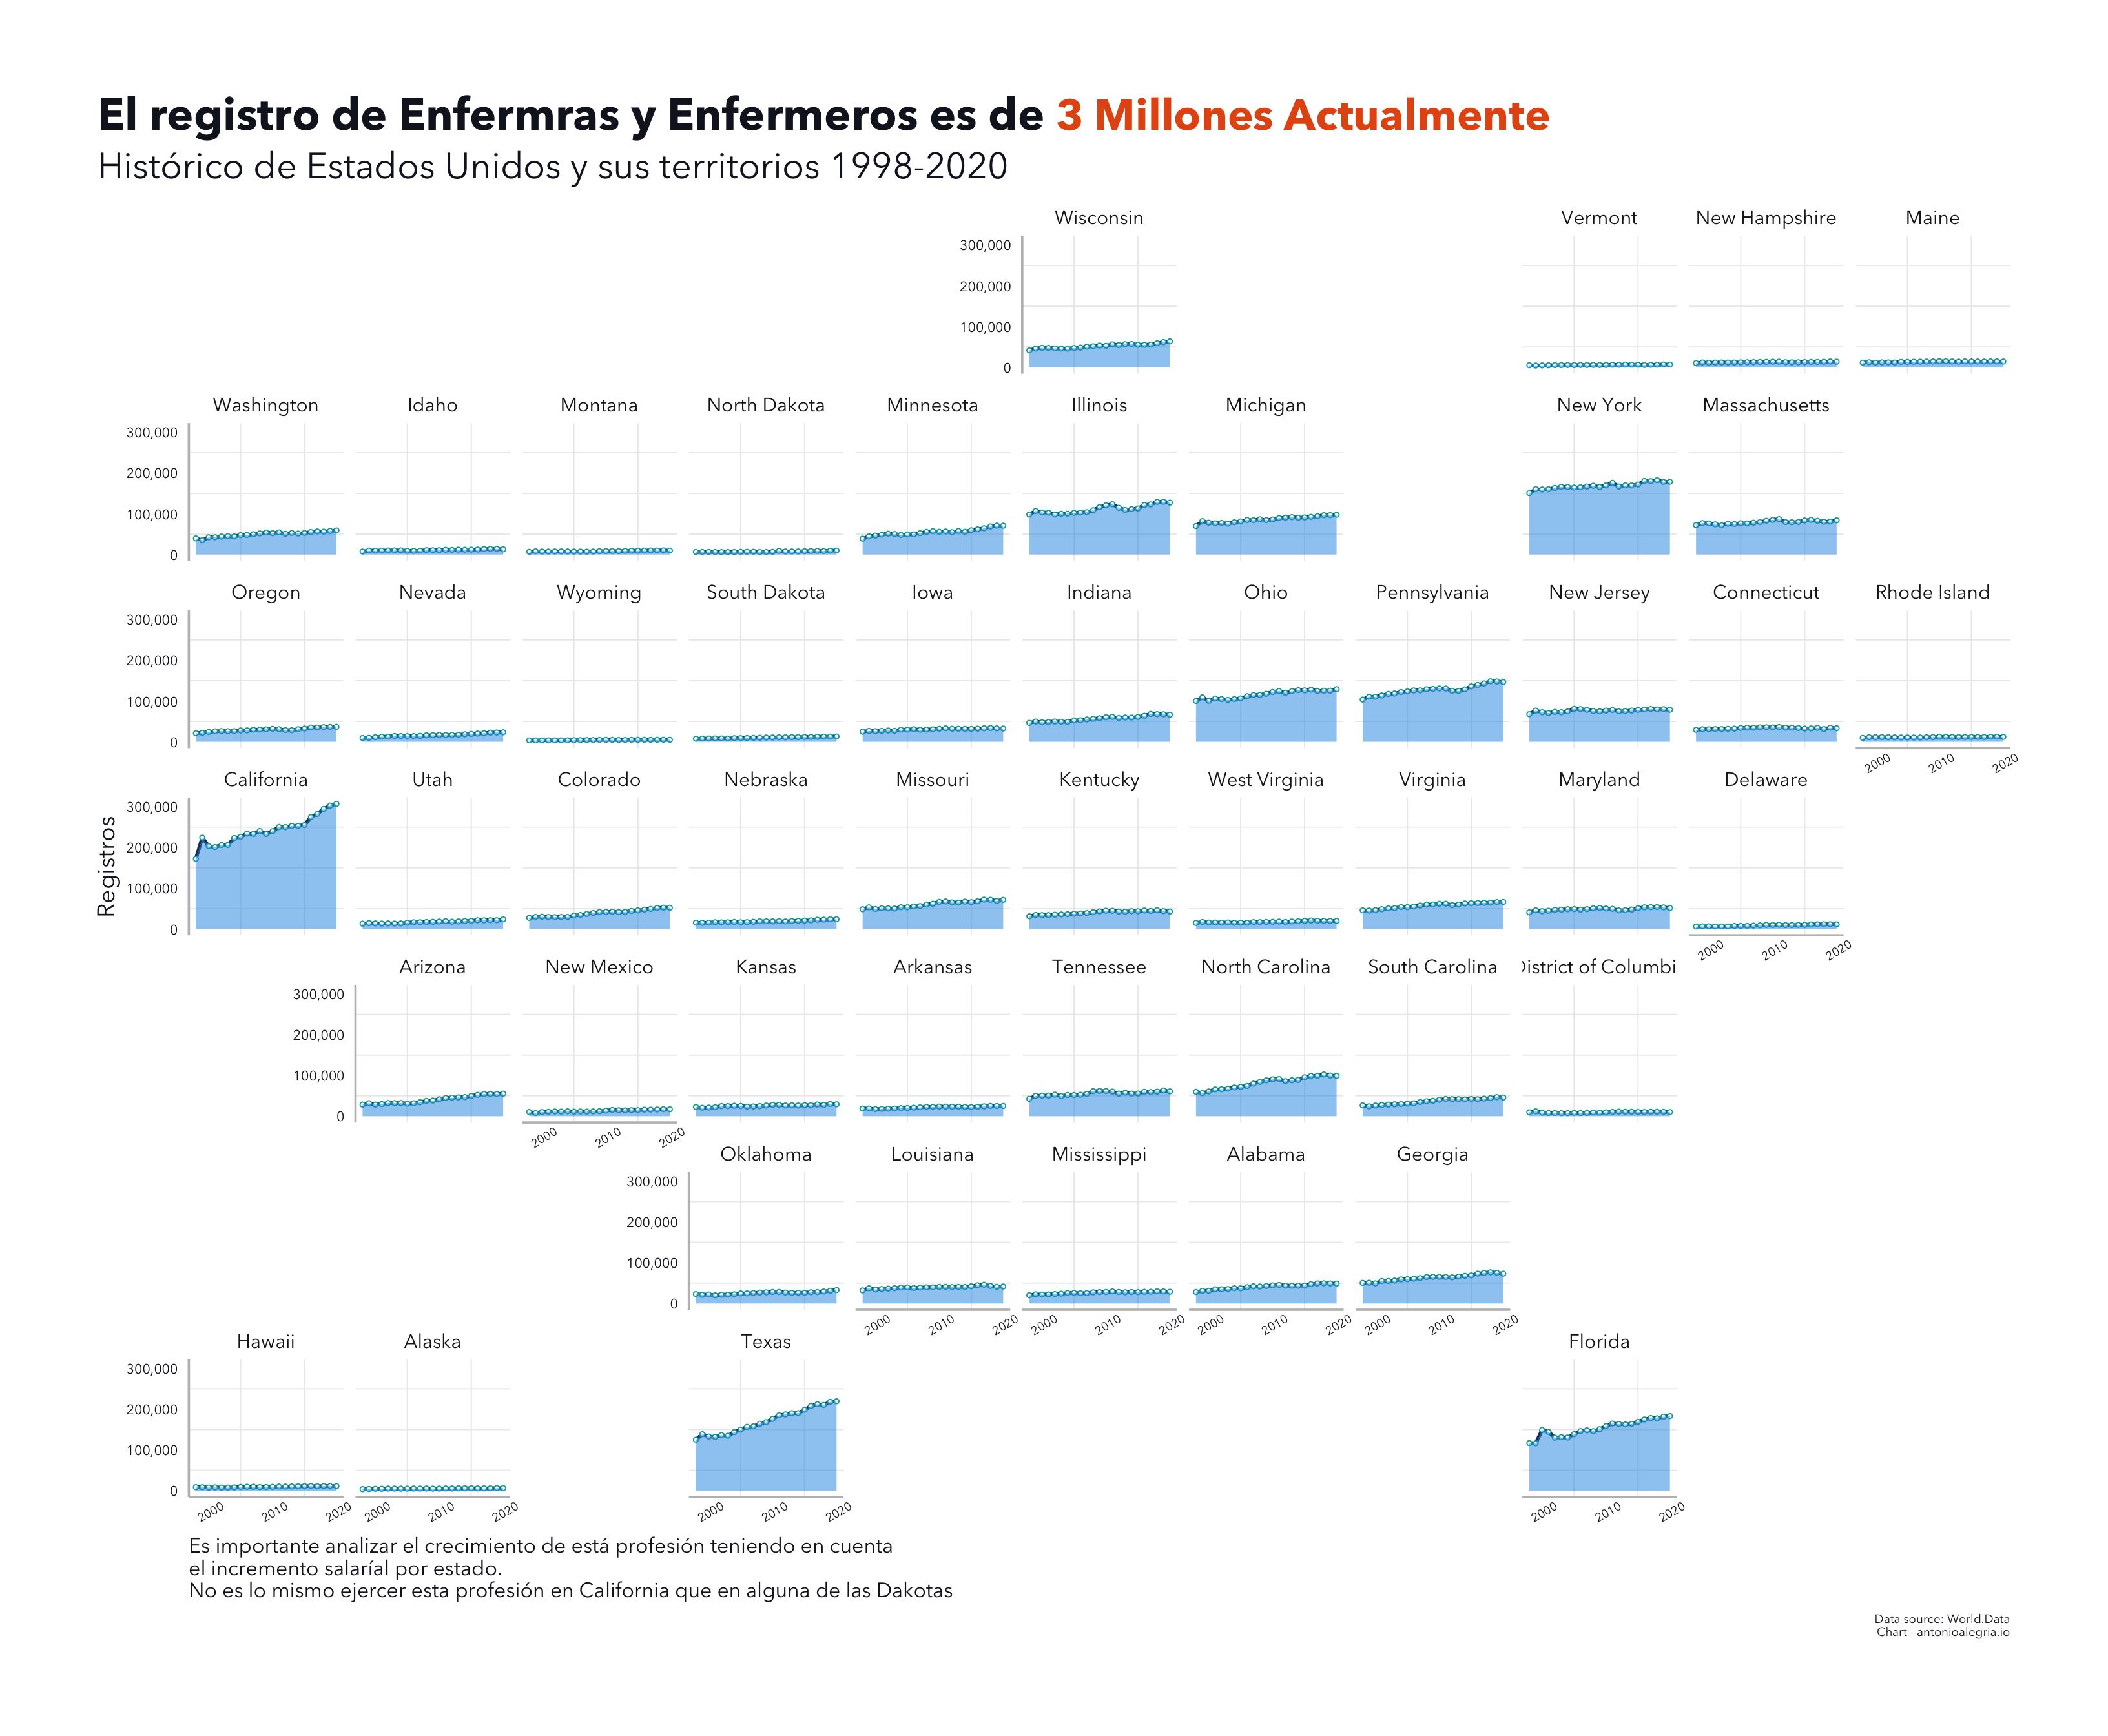
Registered nurse workforce changes in each US state
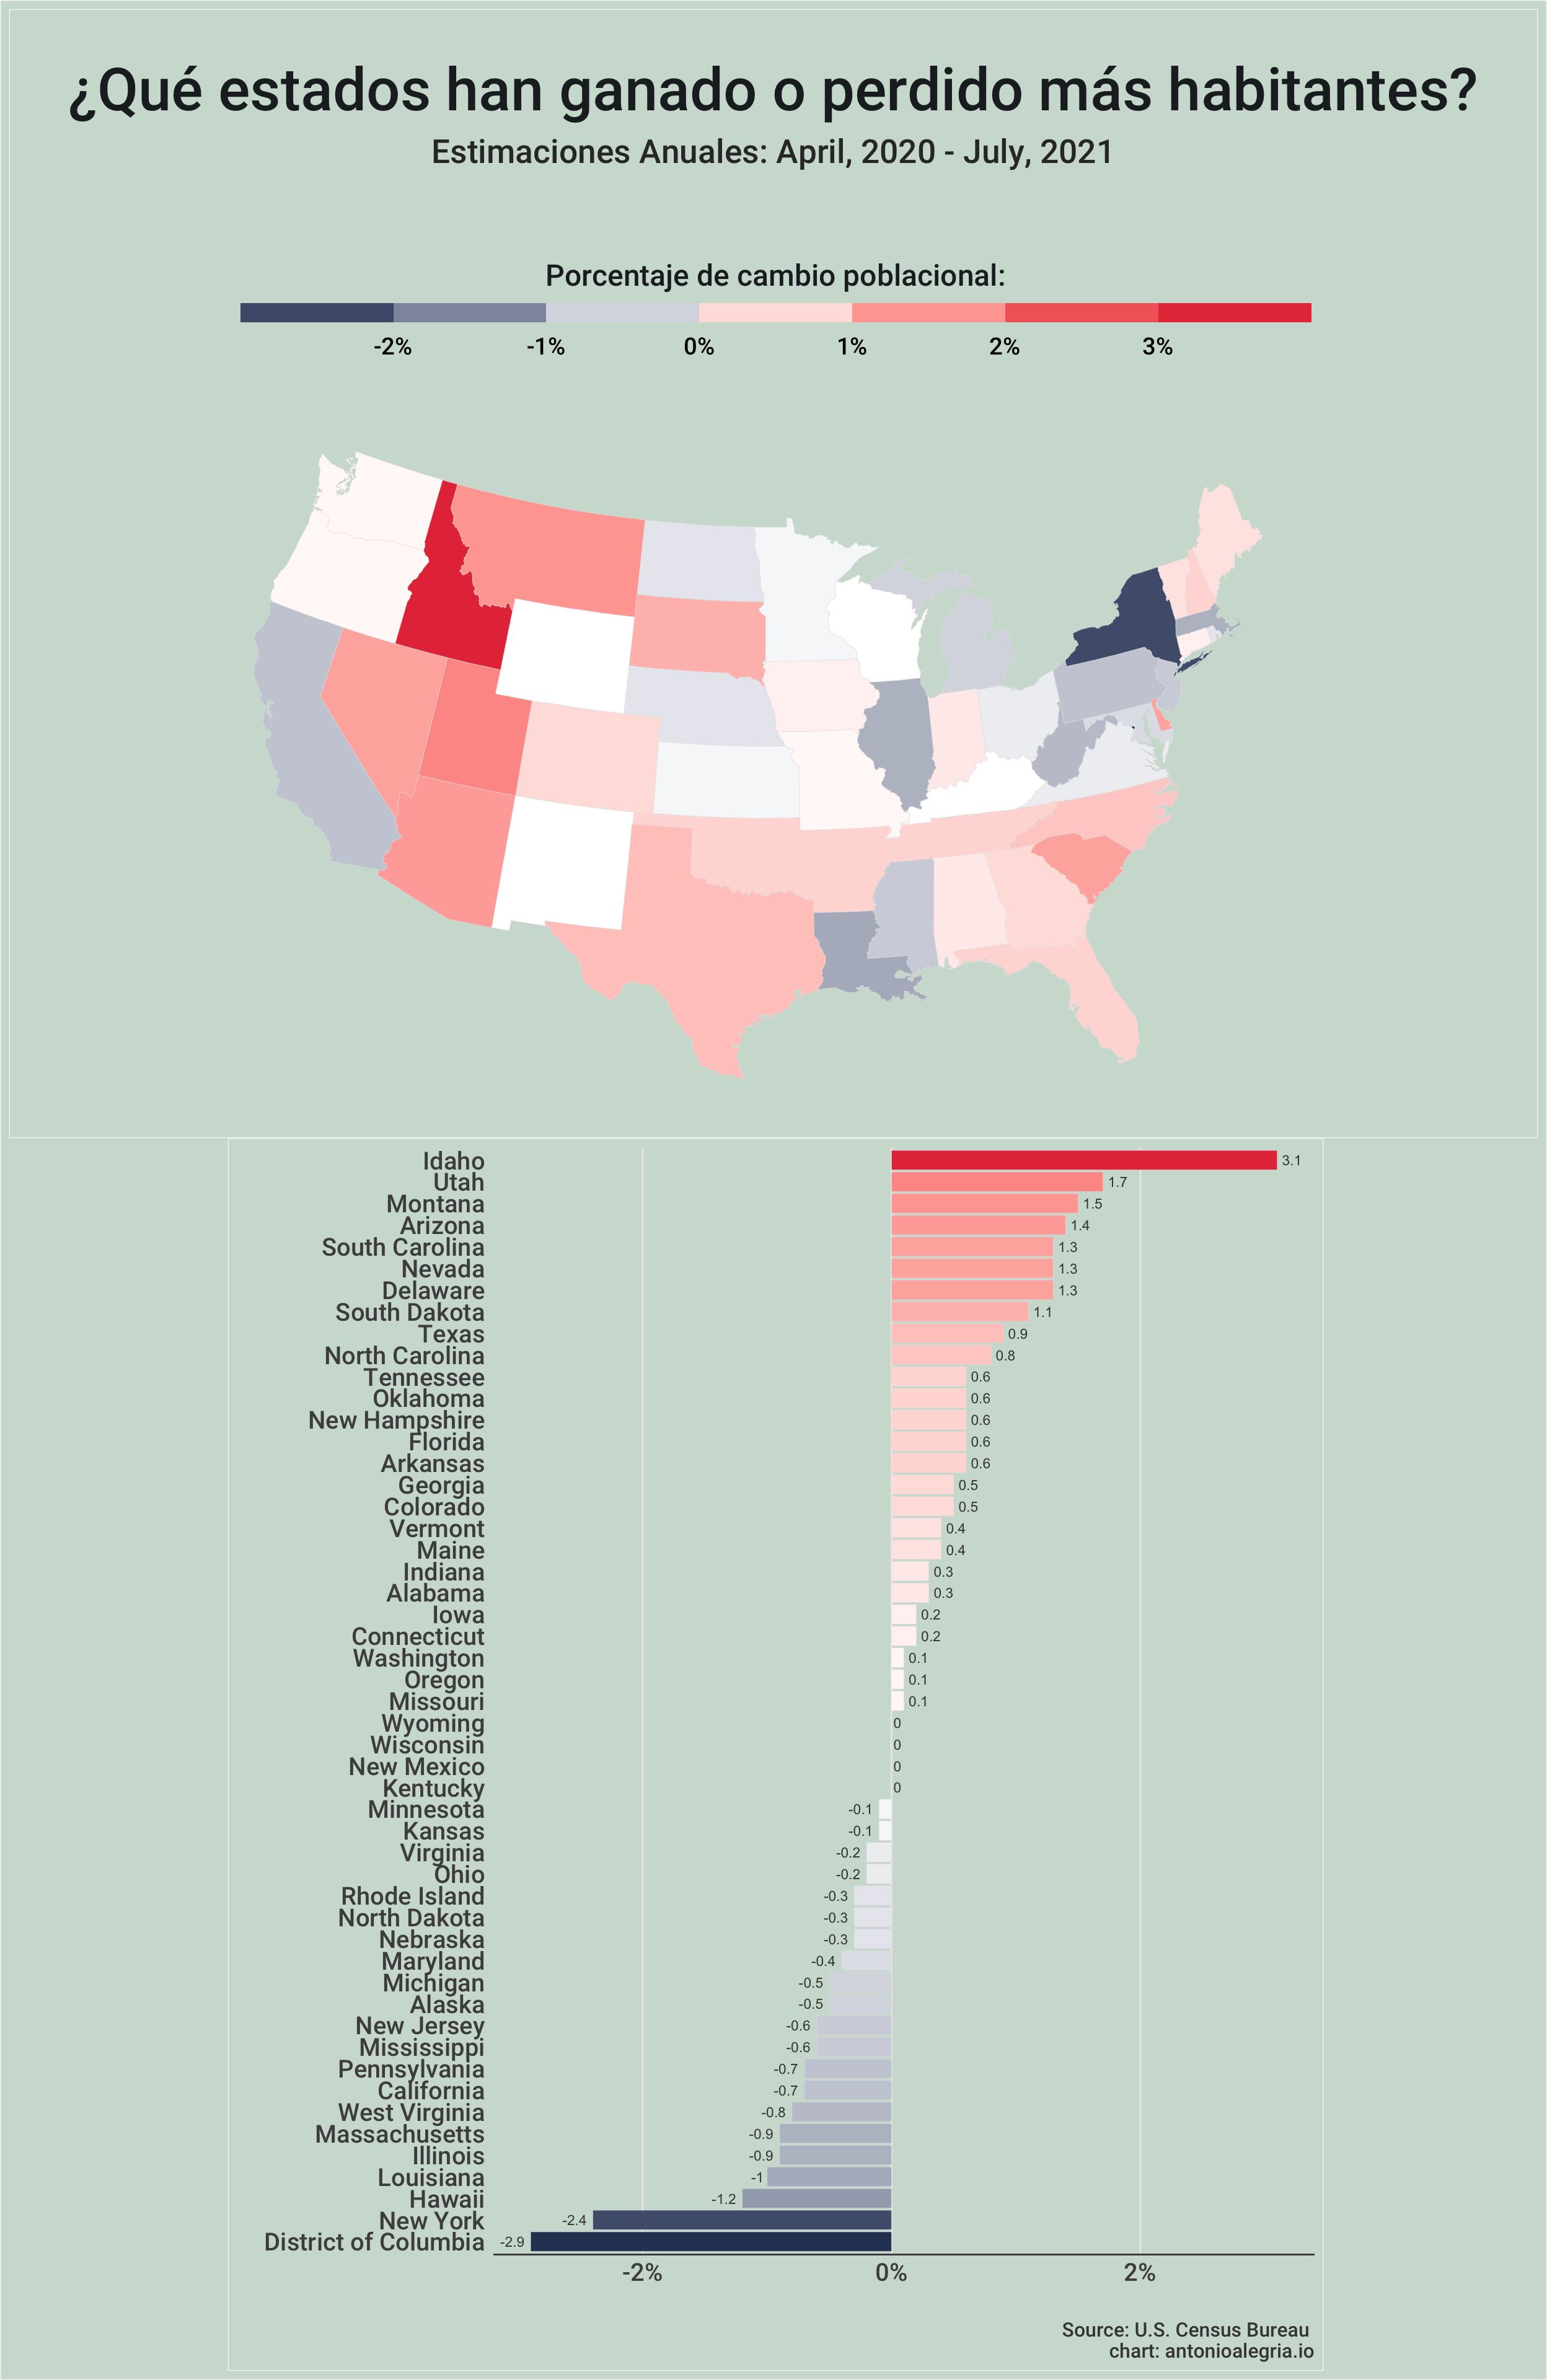
Migration Between US states From 2020 to 2021
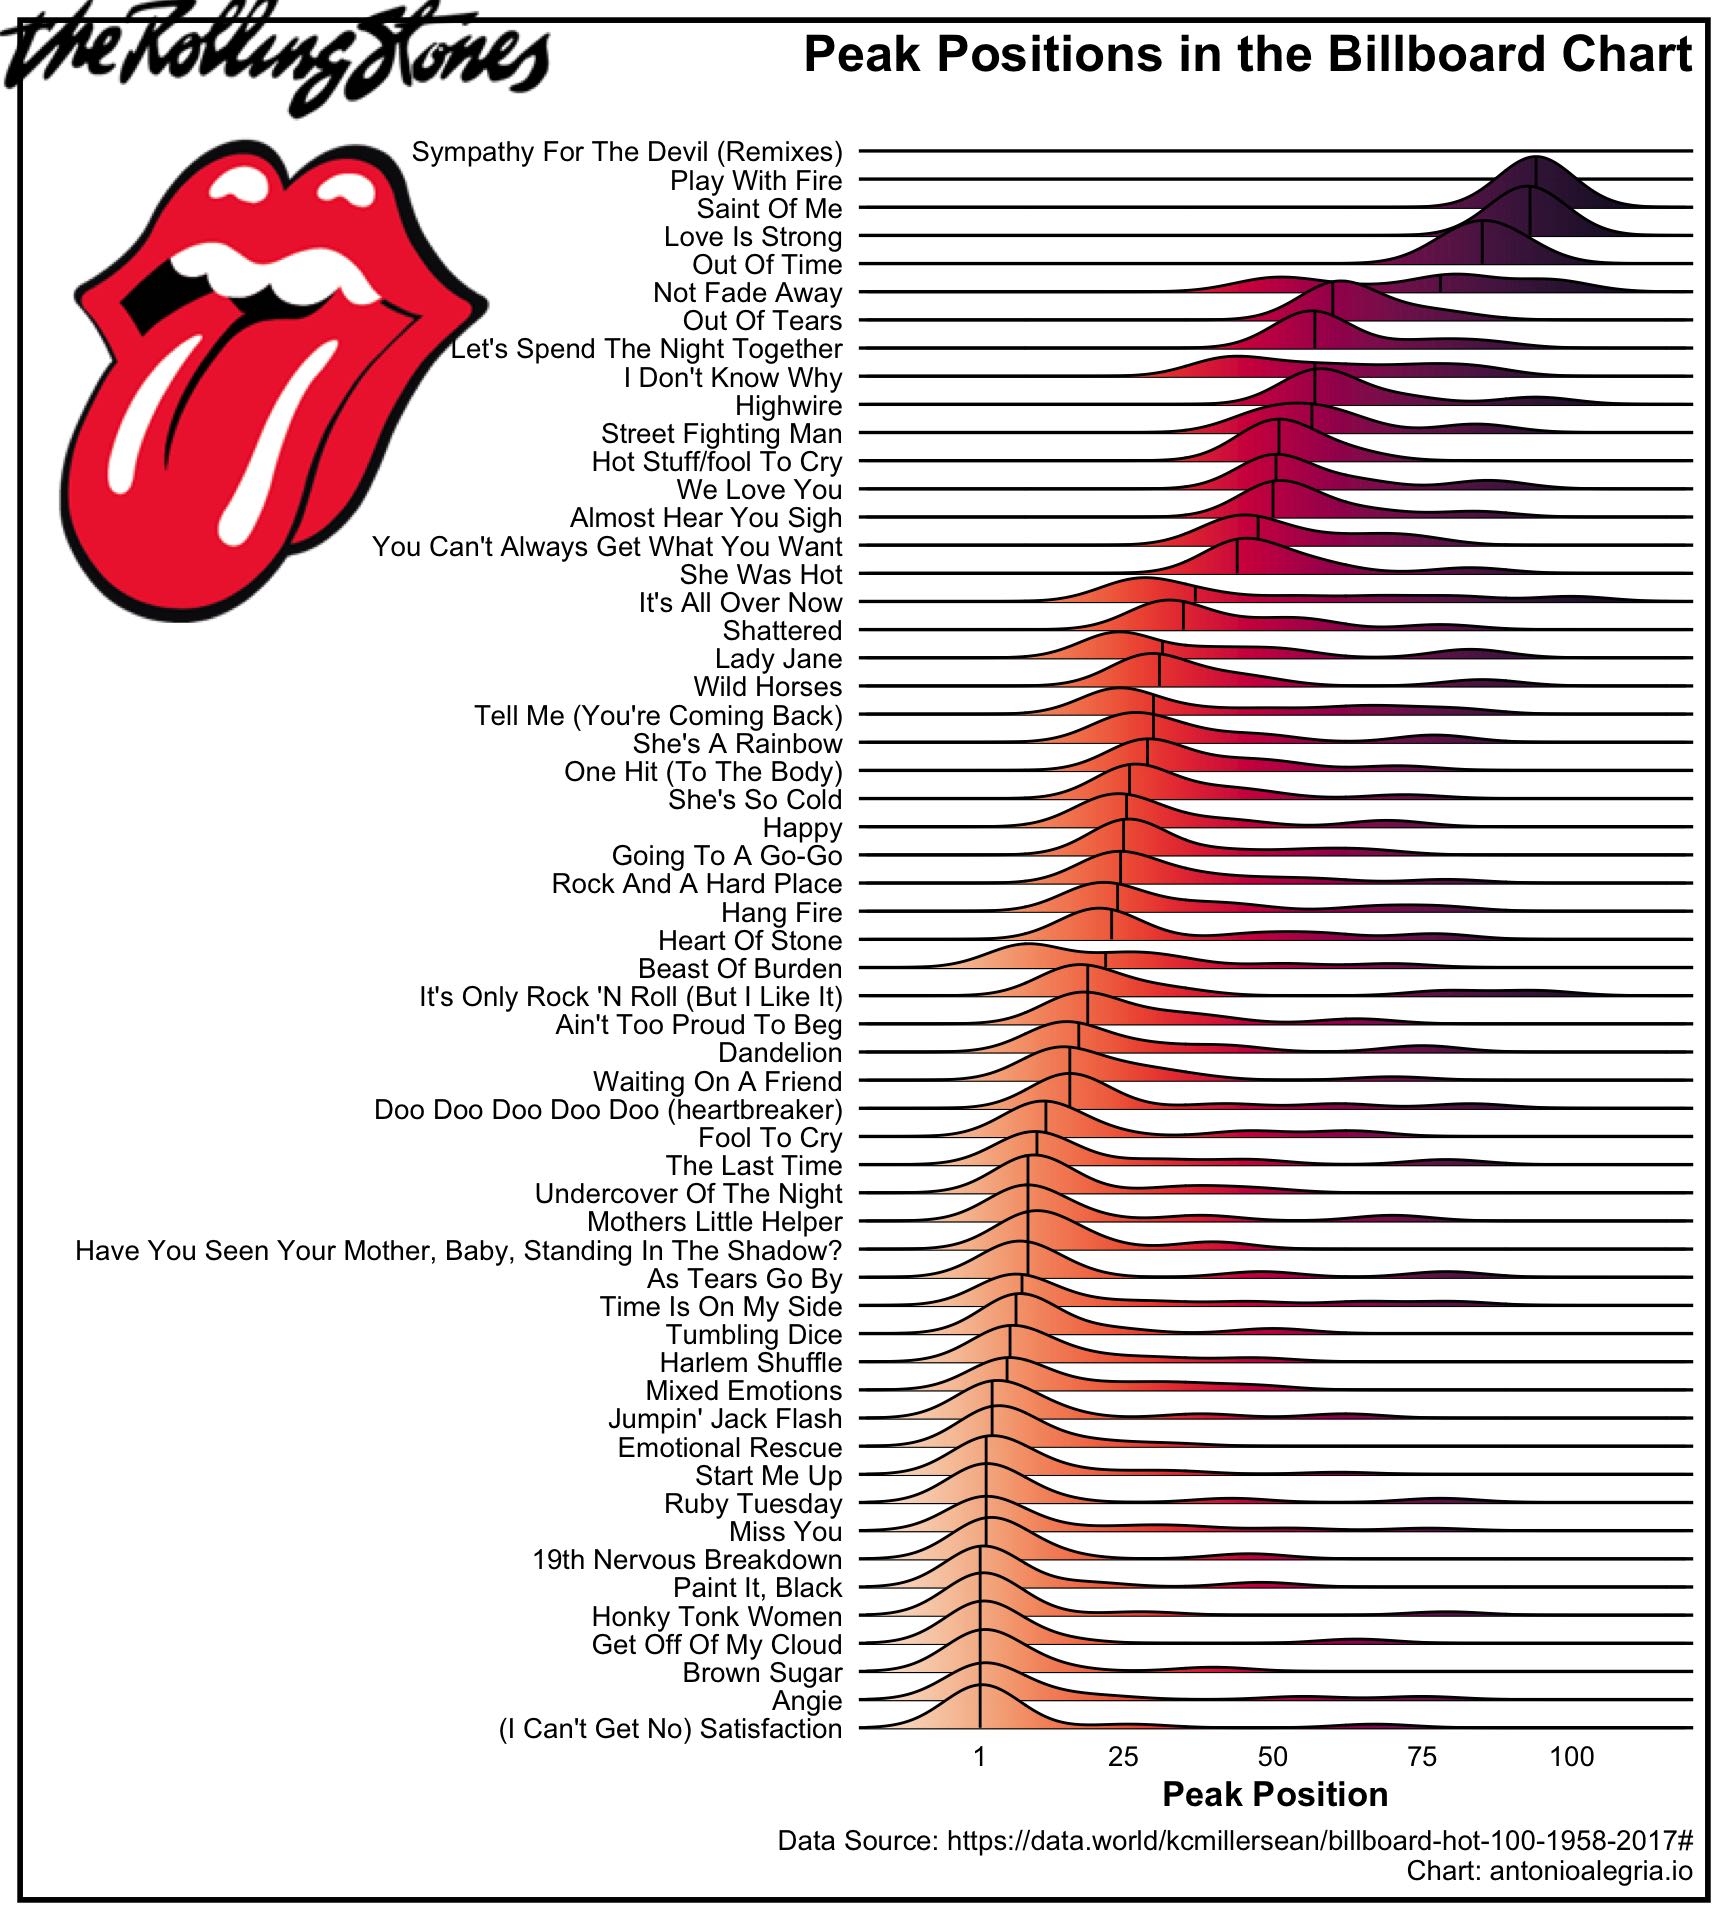
Rolling Stones Billboard Peak Position
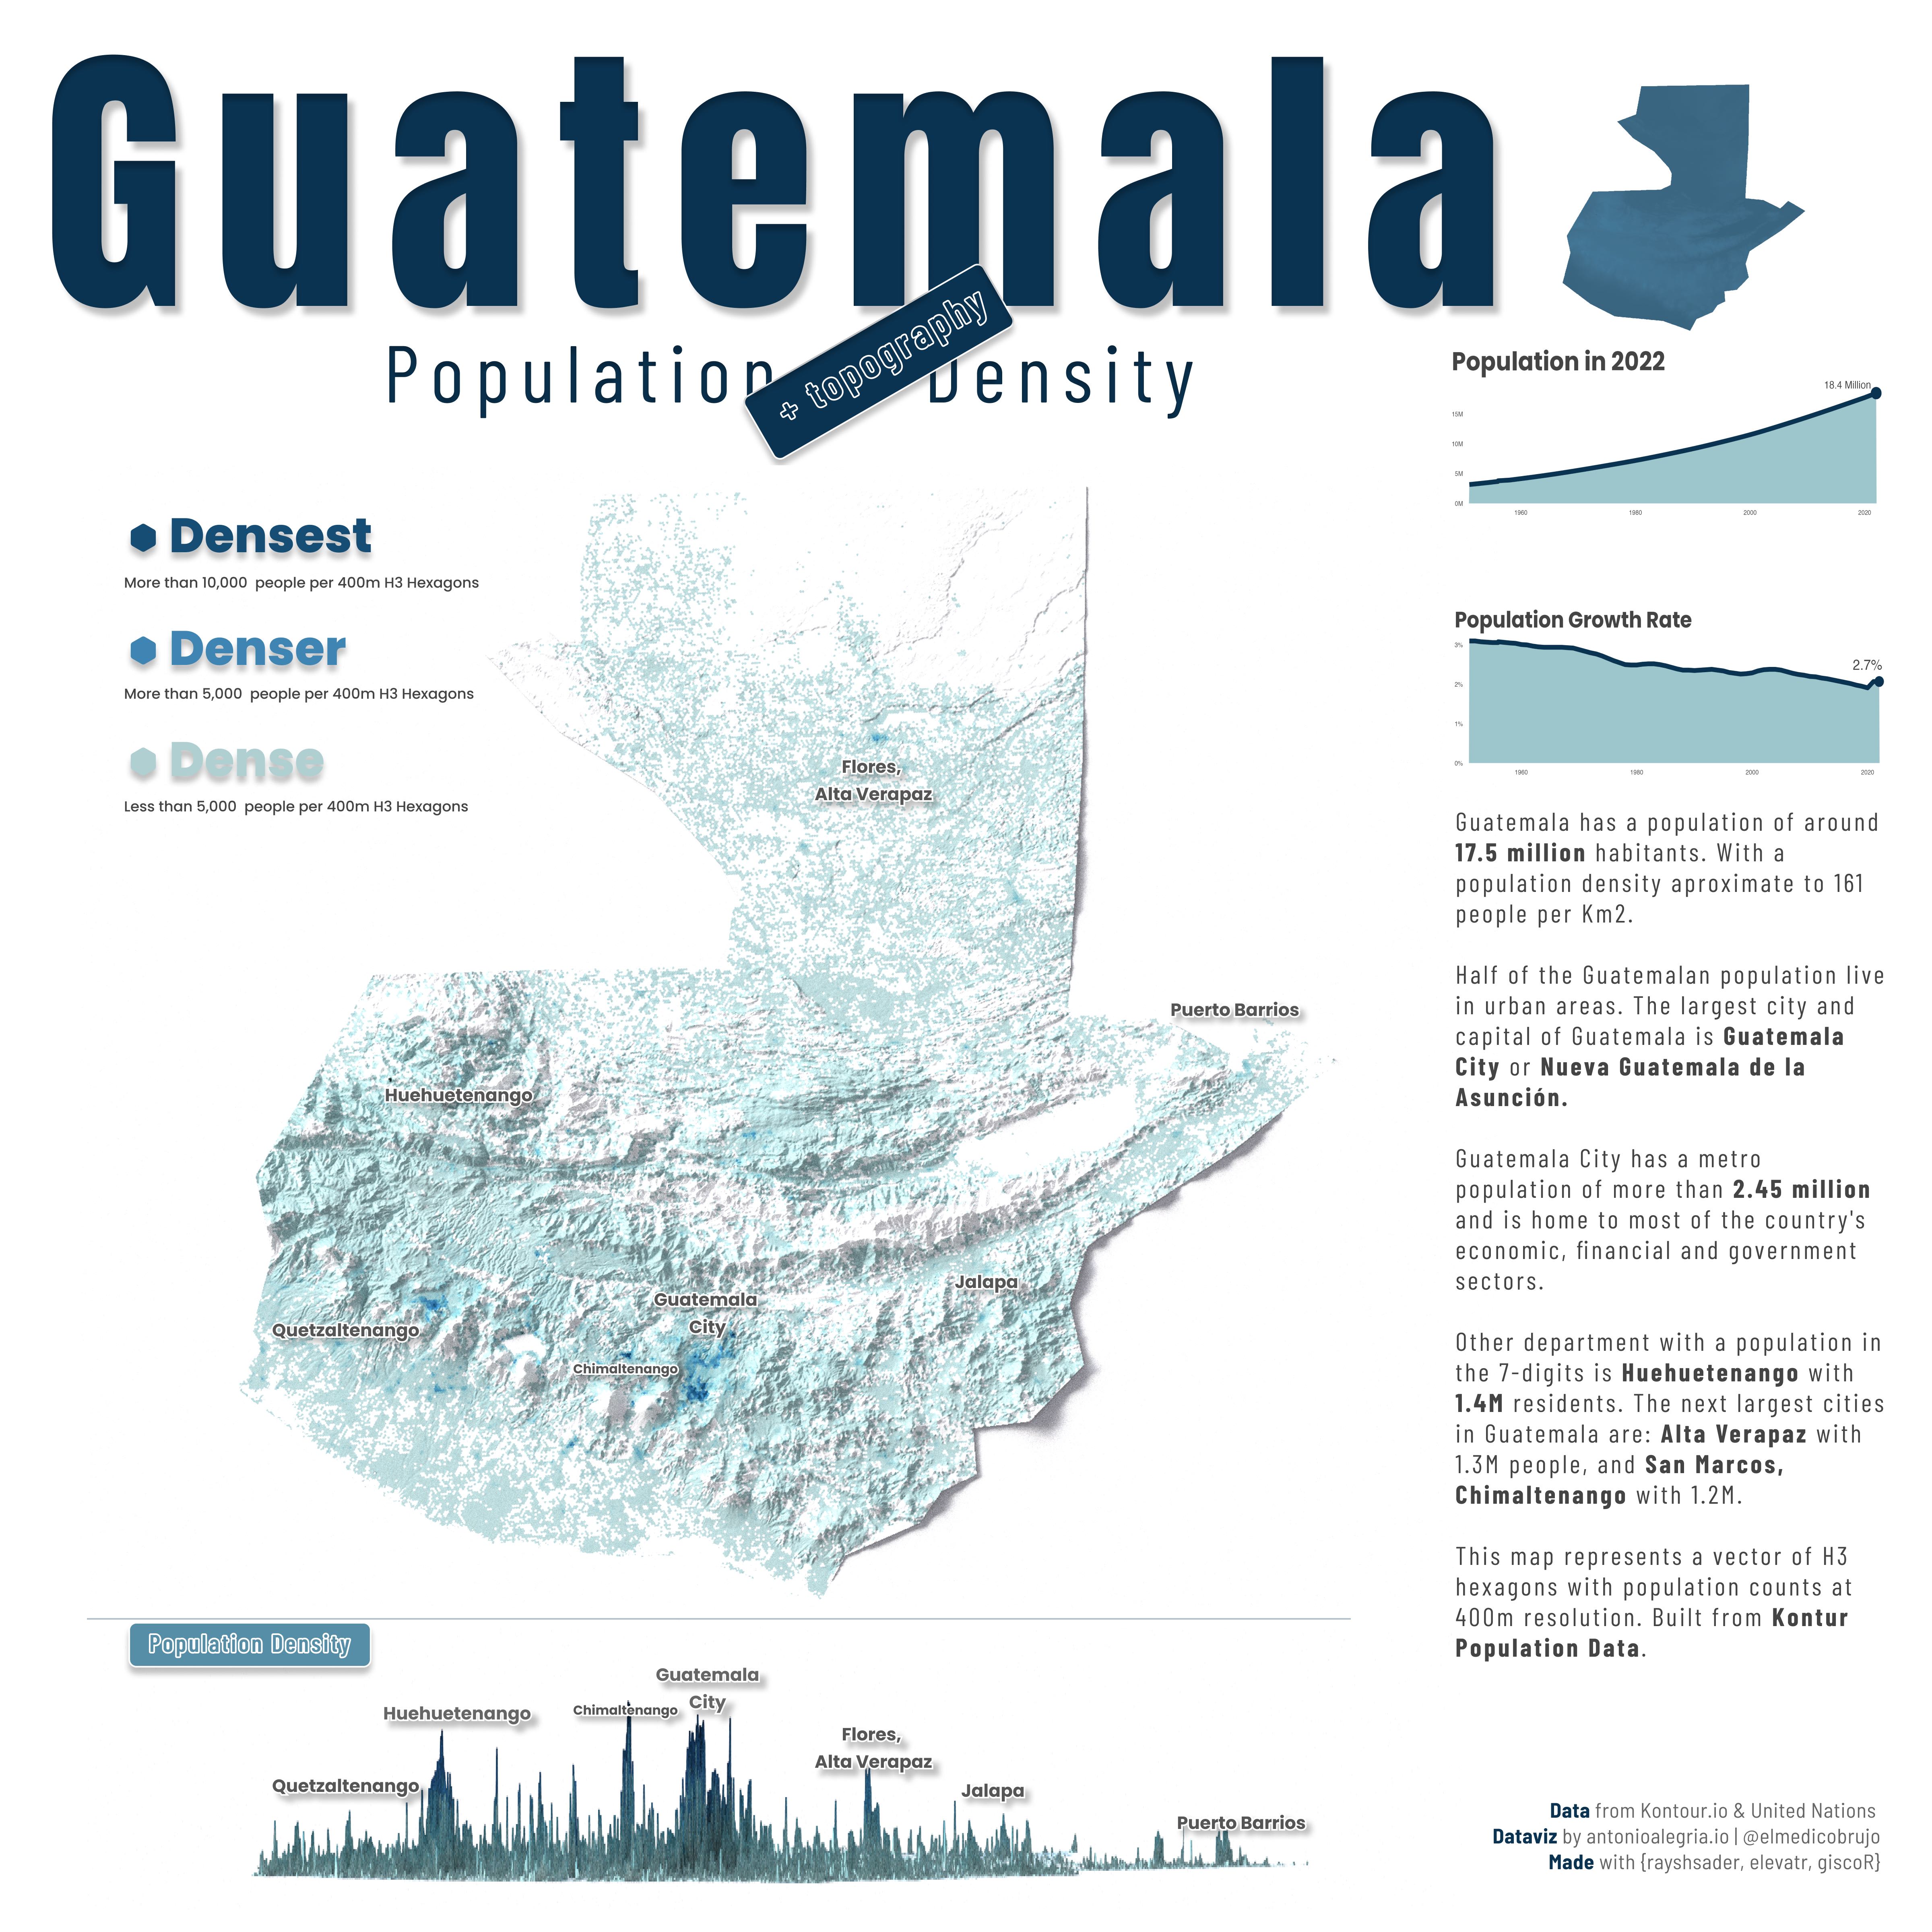
Guatemala Population Density and Topography
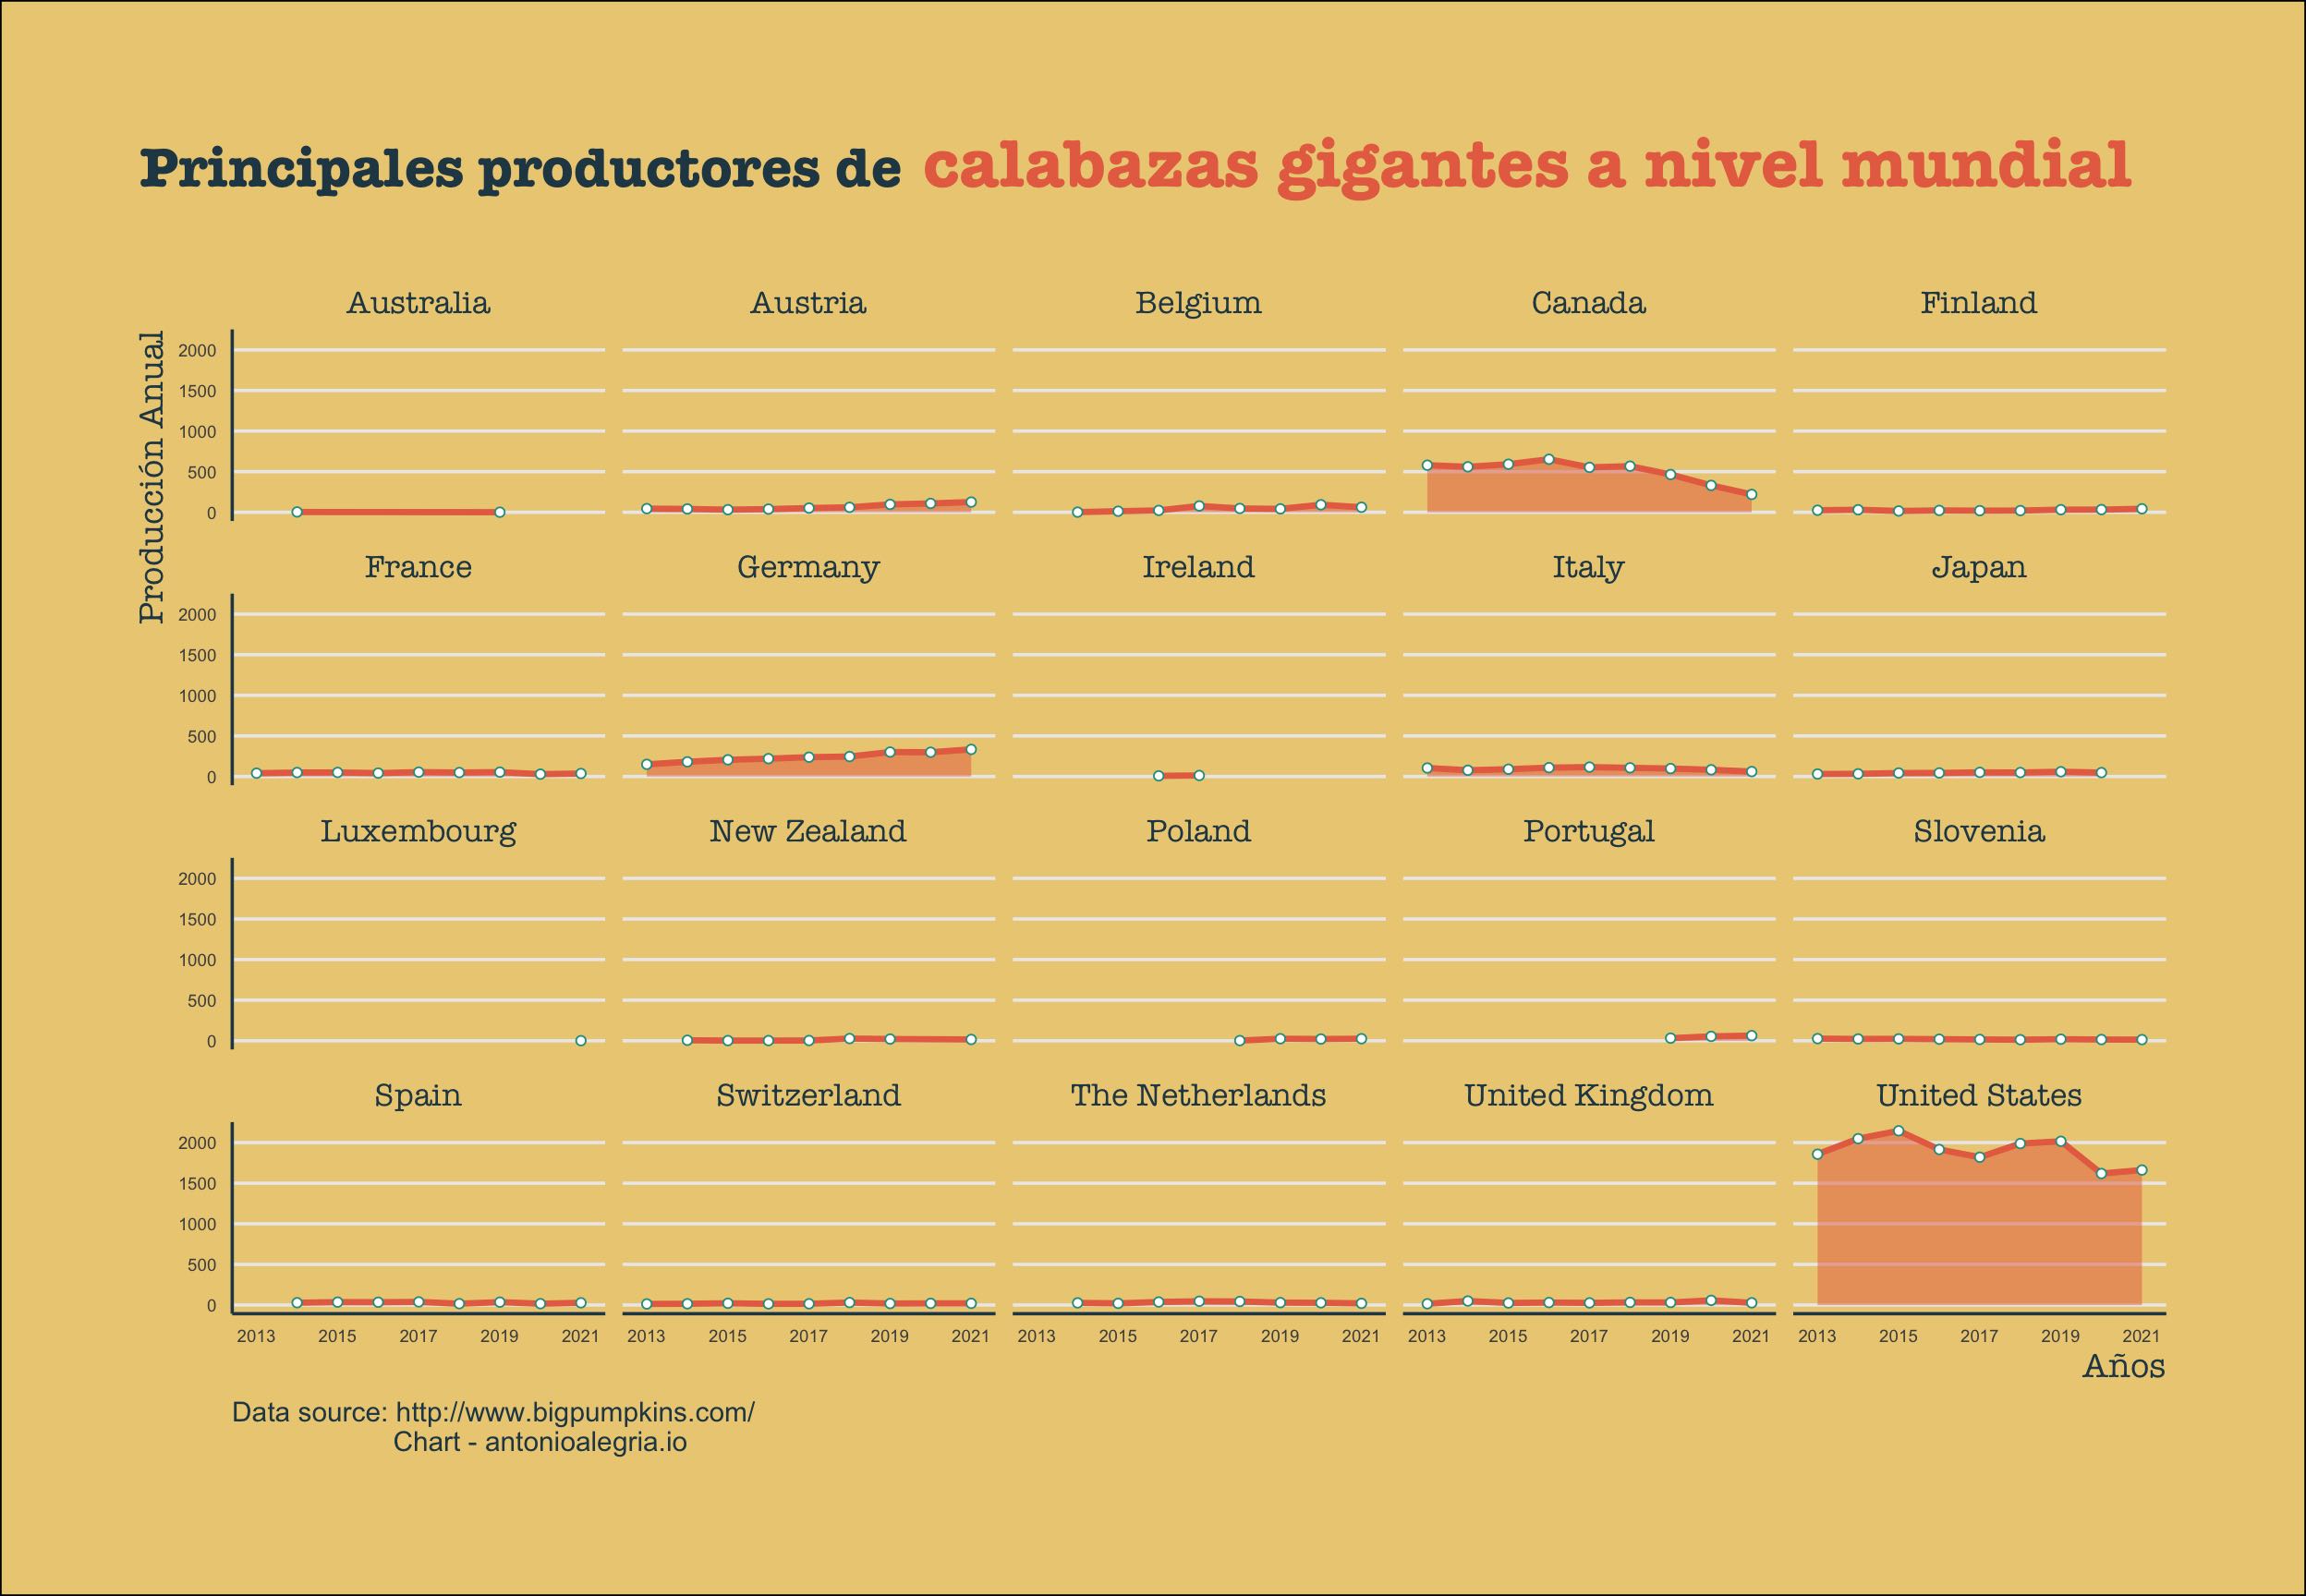
Worldwide Giant Pumpkin Production
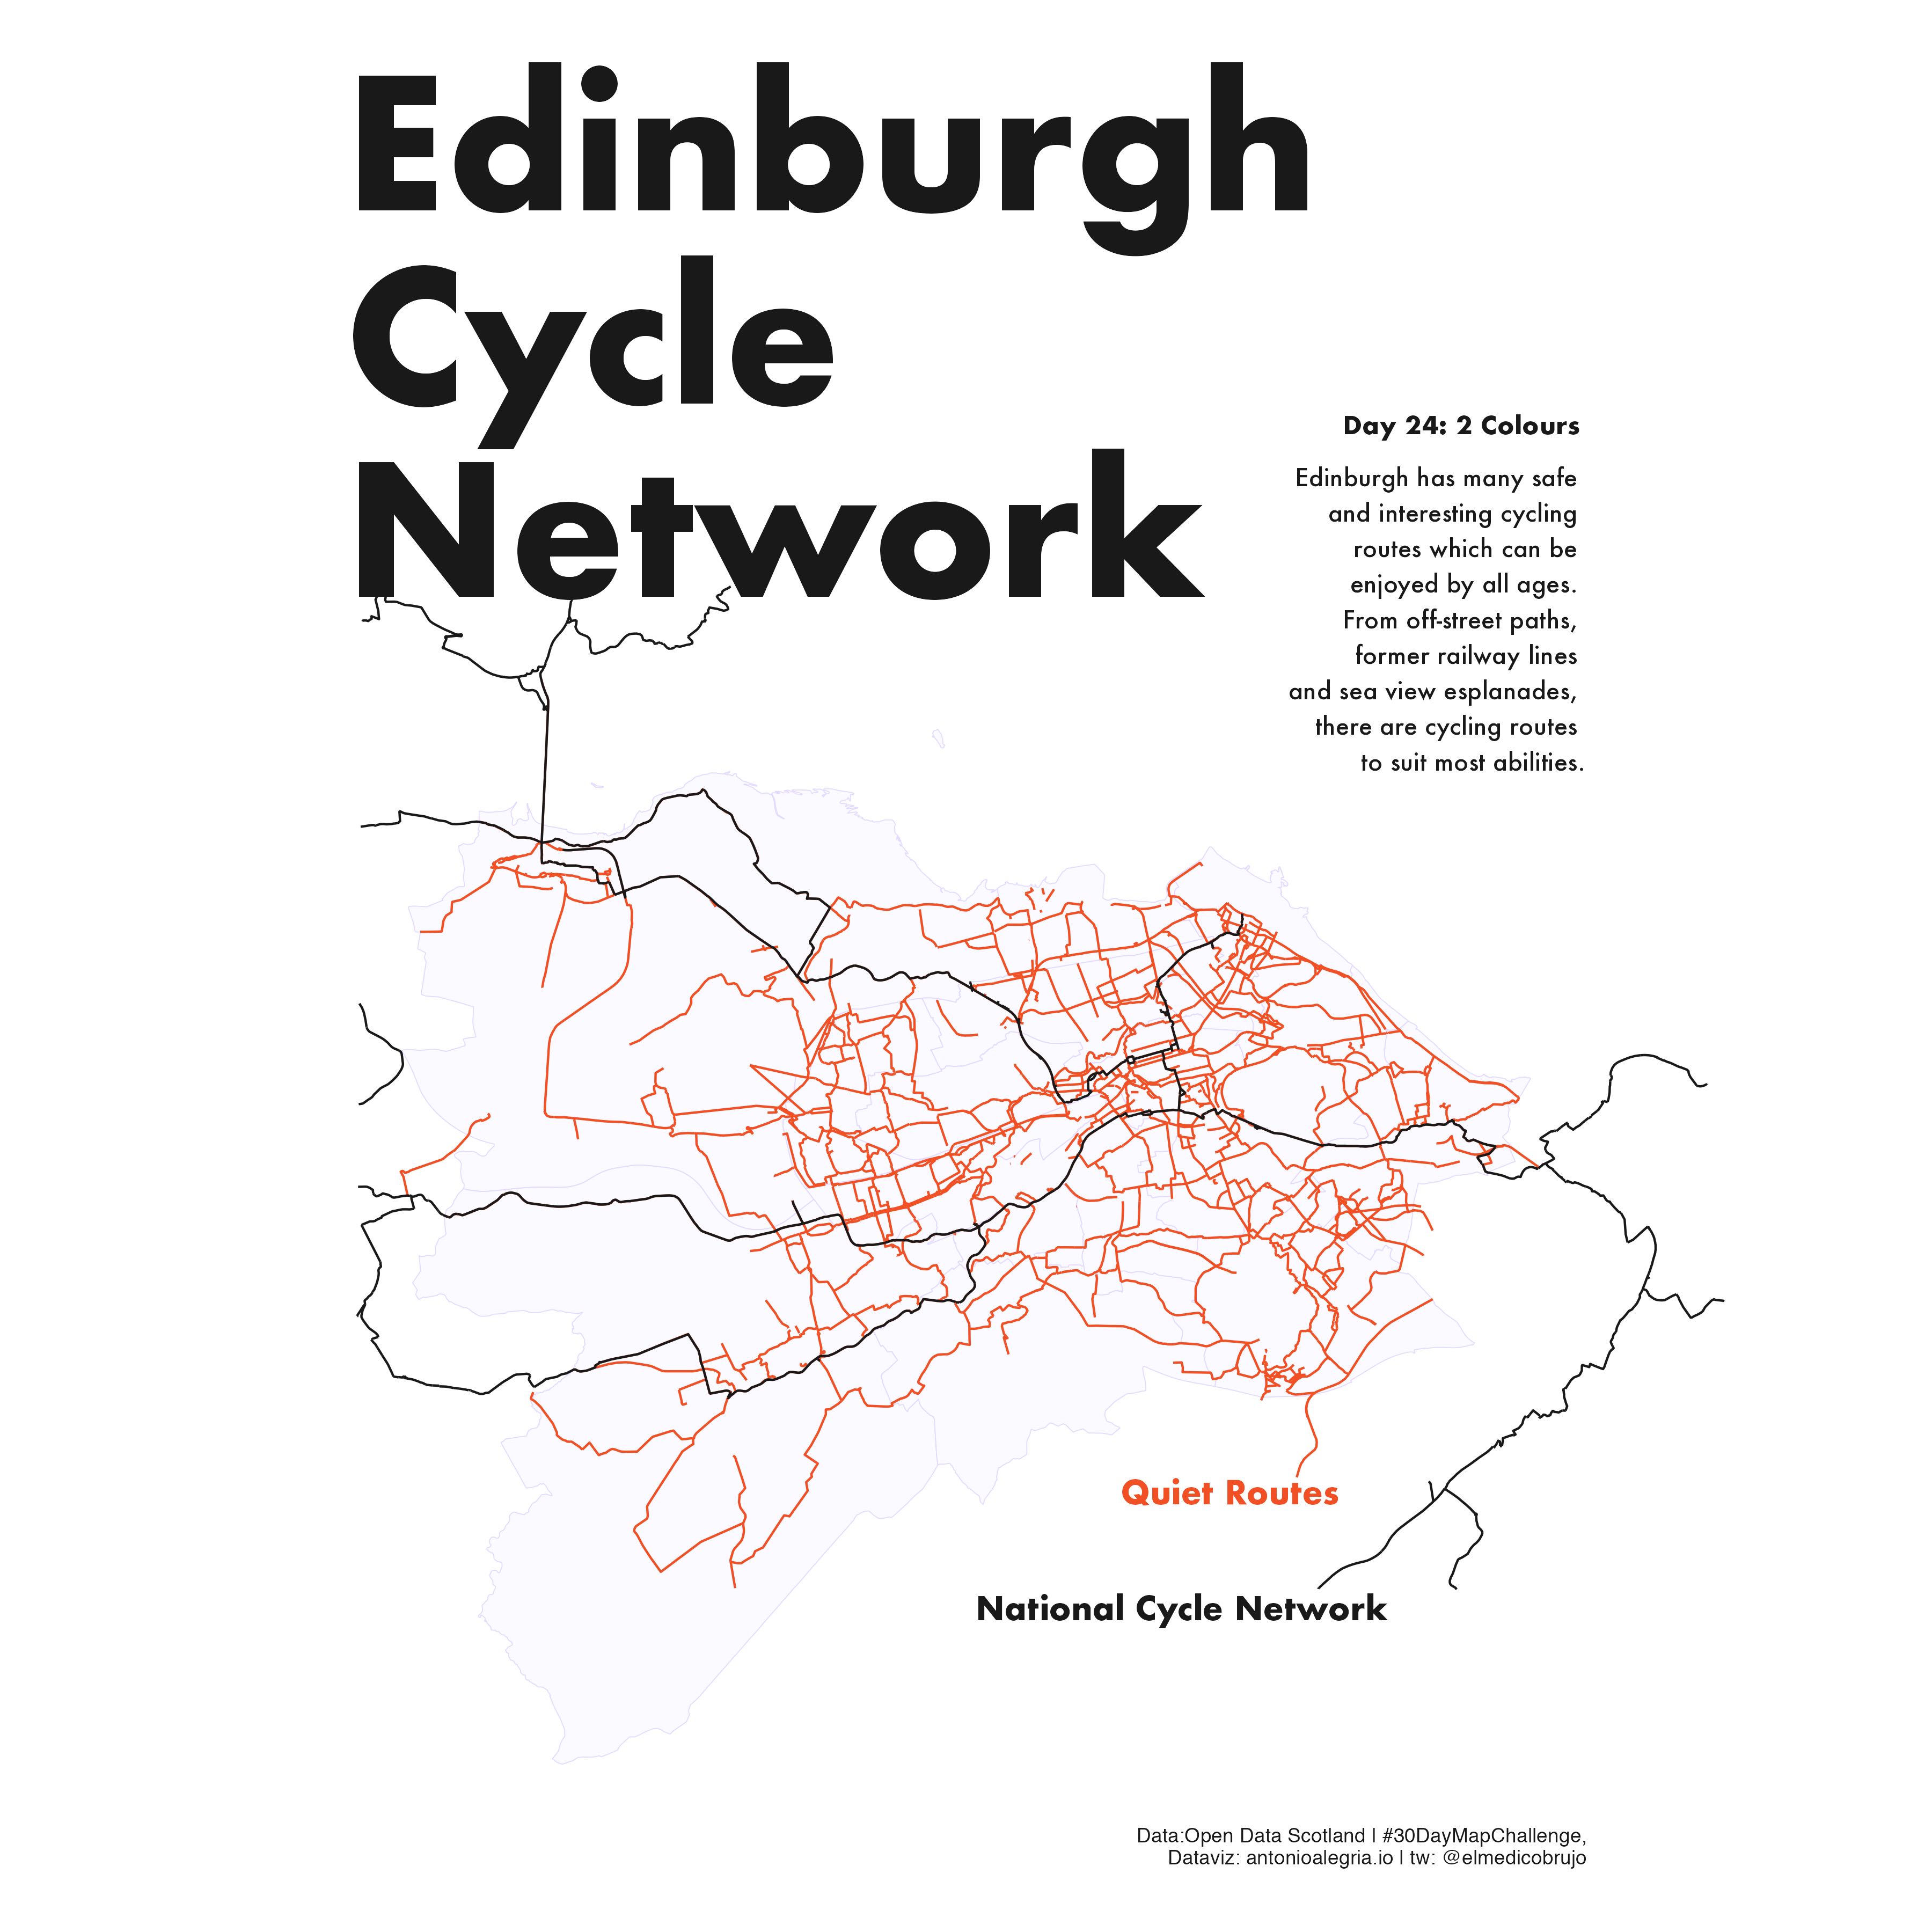
Edinburgh Cycle Network
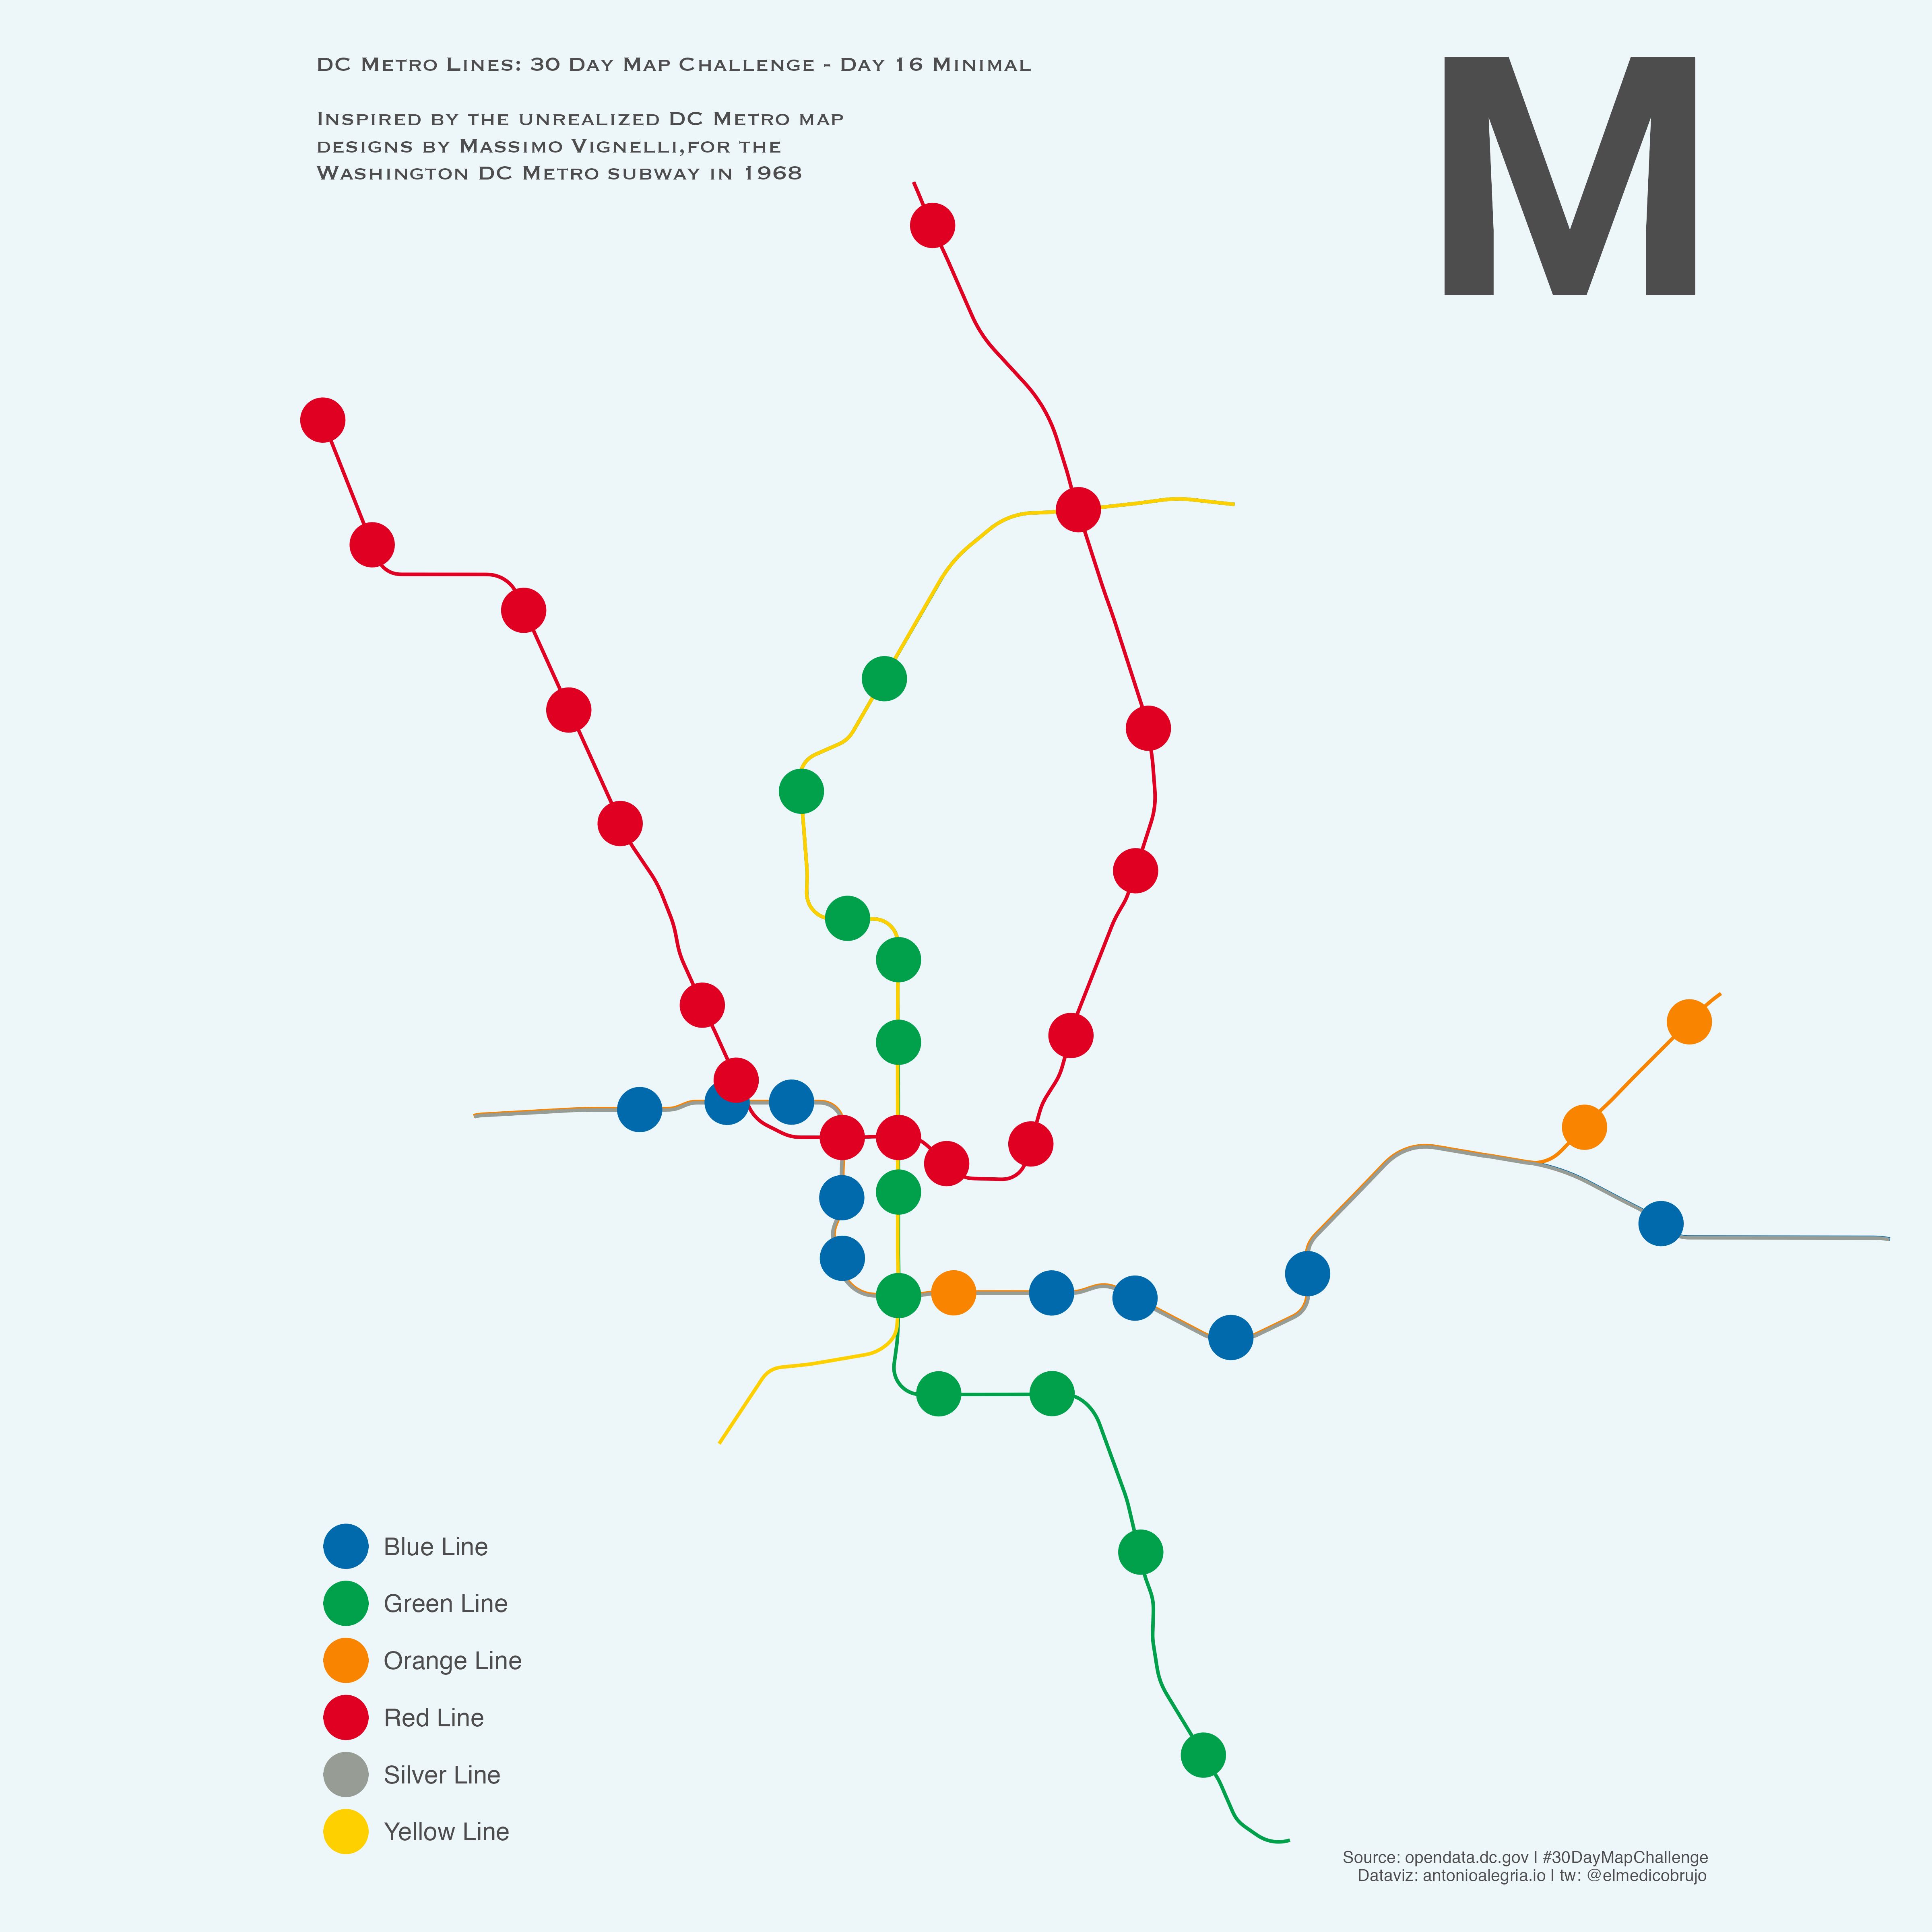
Washington DC metro system with Vignelli-influenced design
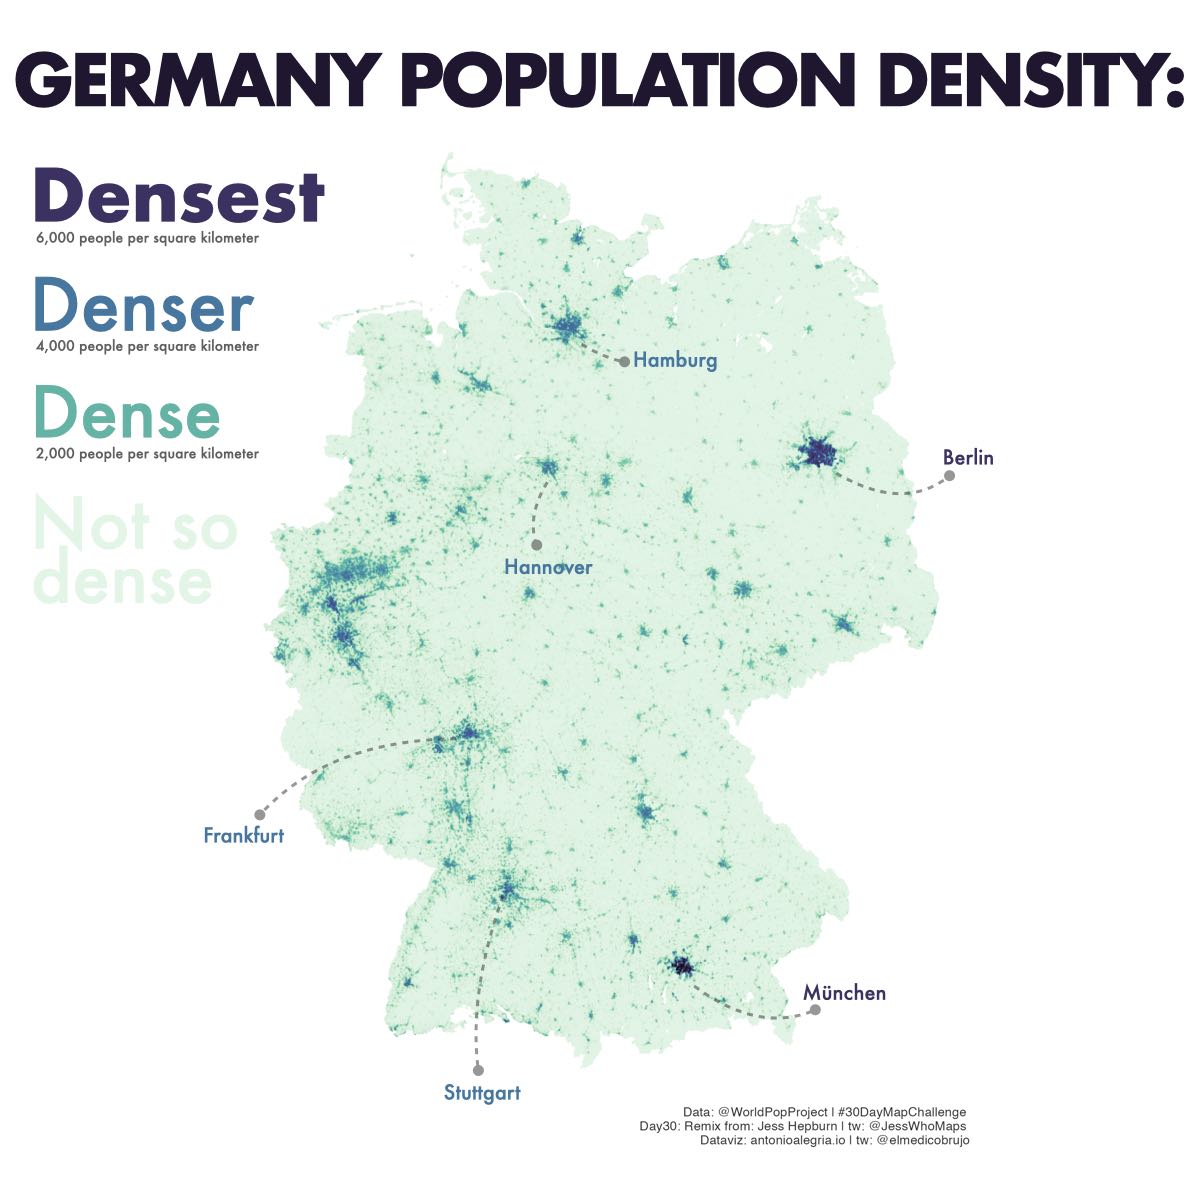
Population density map of Germany
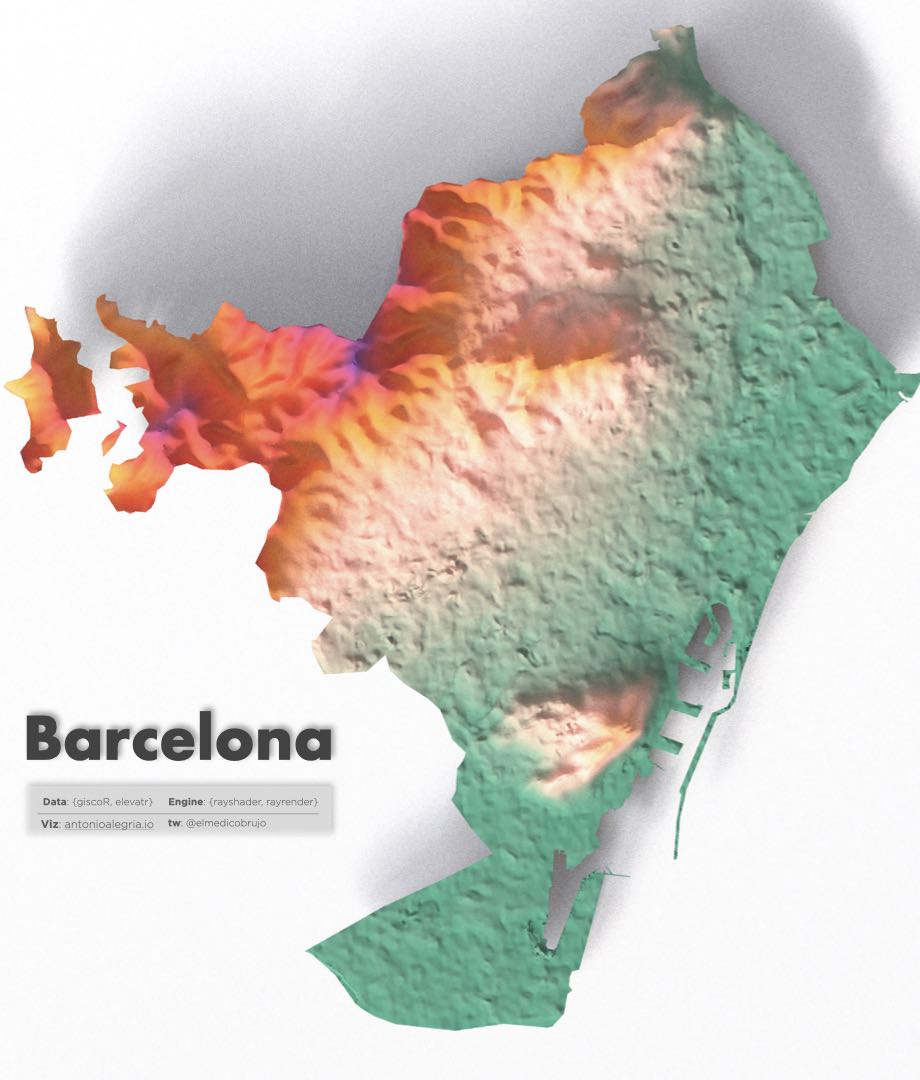
Barcelona Raytracing with {rayshader}
Daily Ridership of Mexico City Metro System
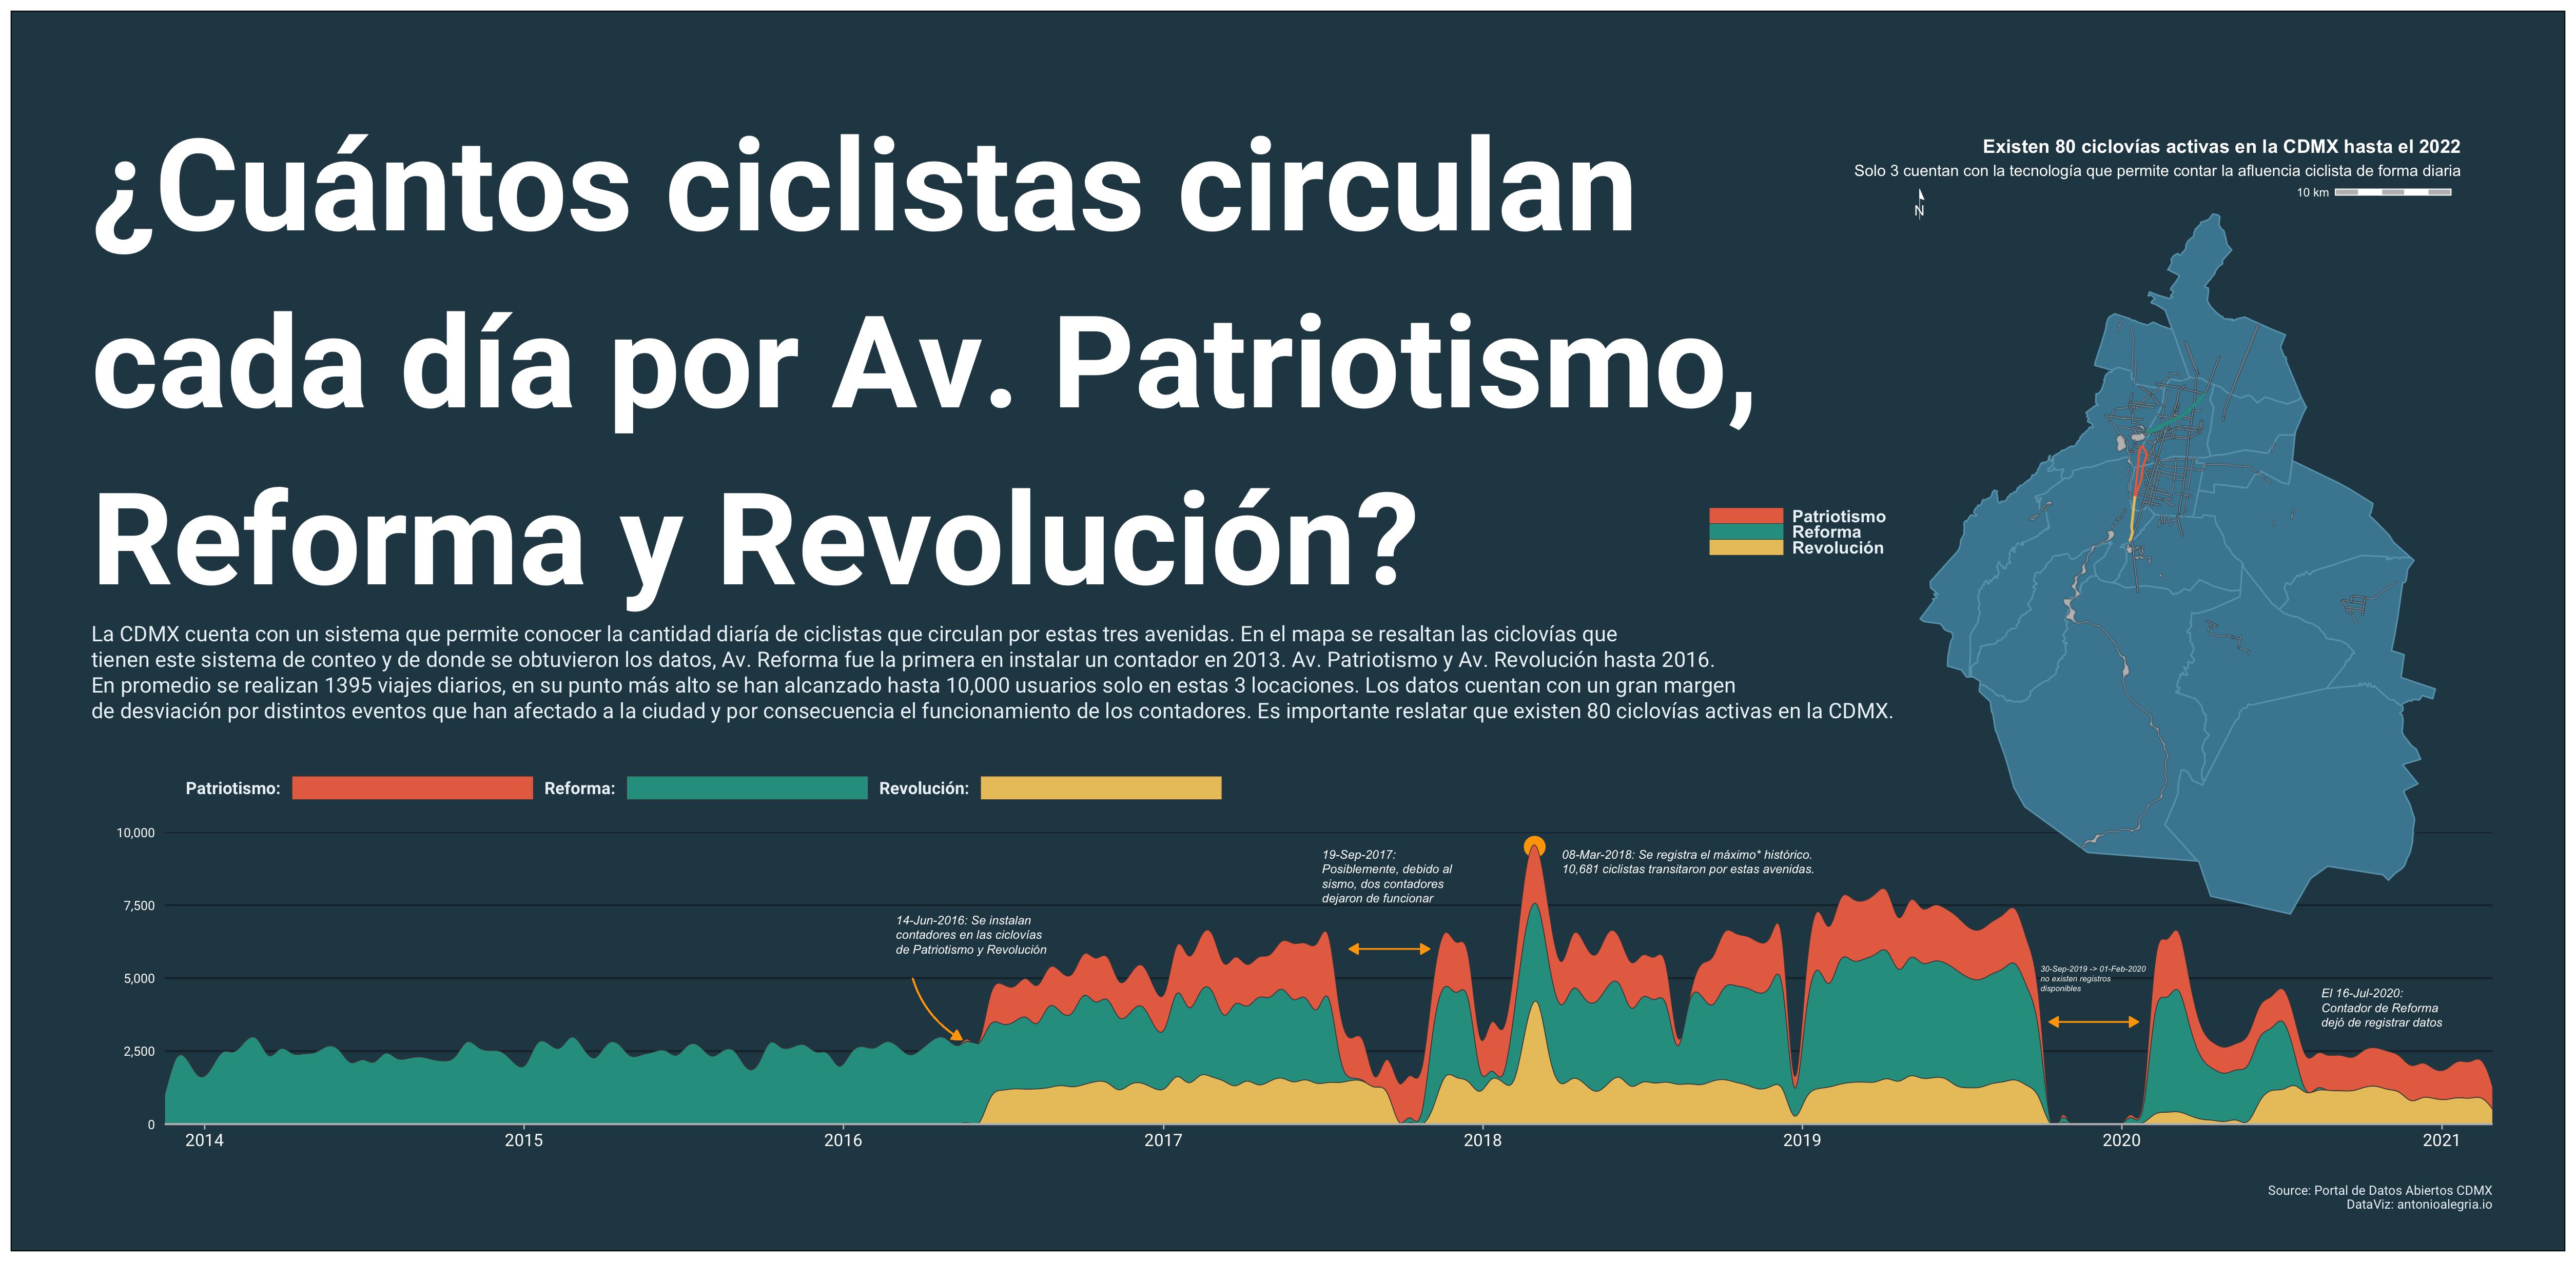
Mexico City Bike Paths
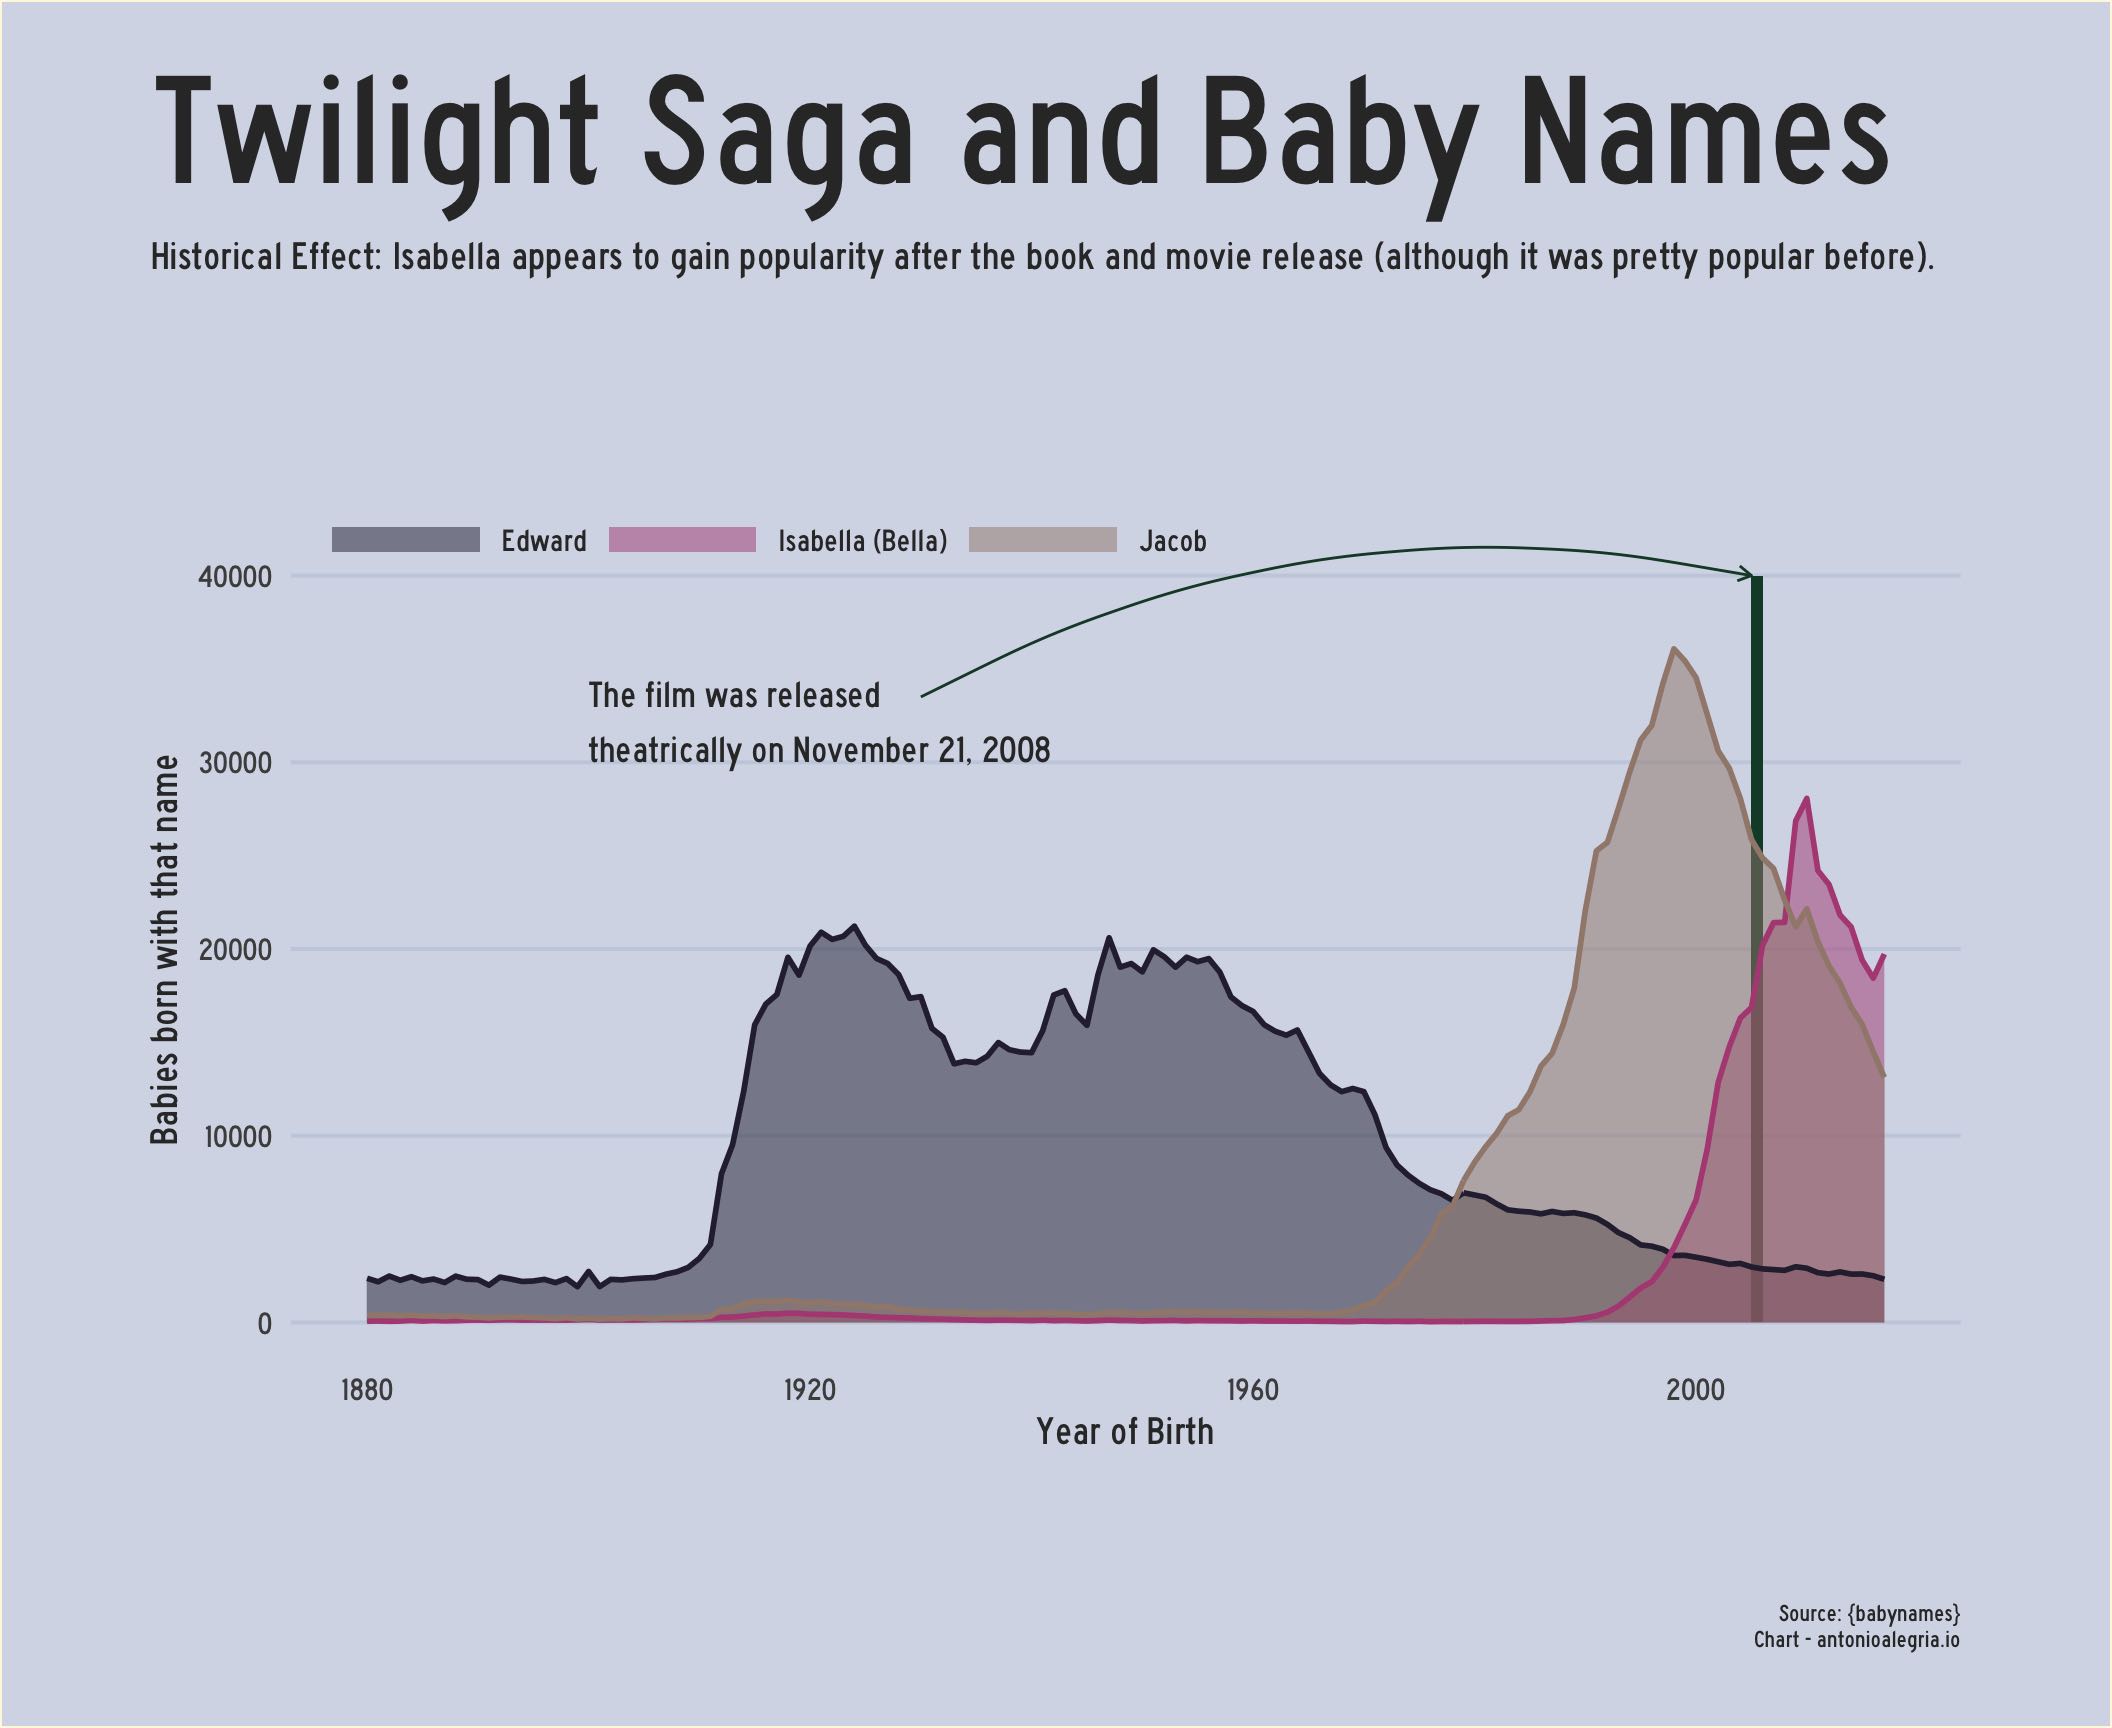
Twilight Saga Baby Names
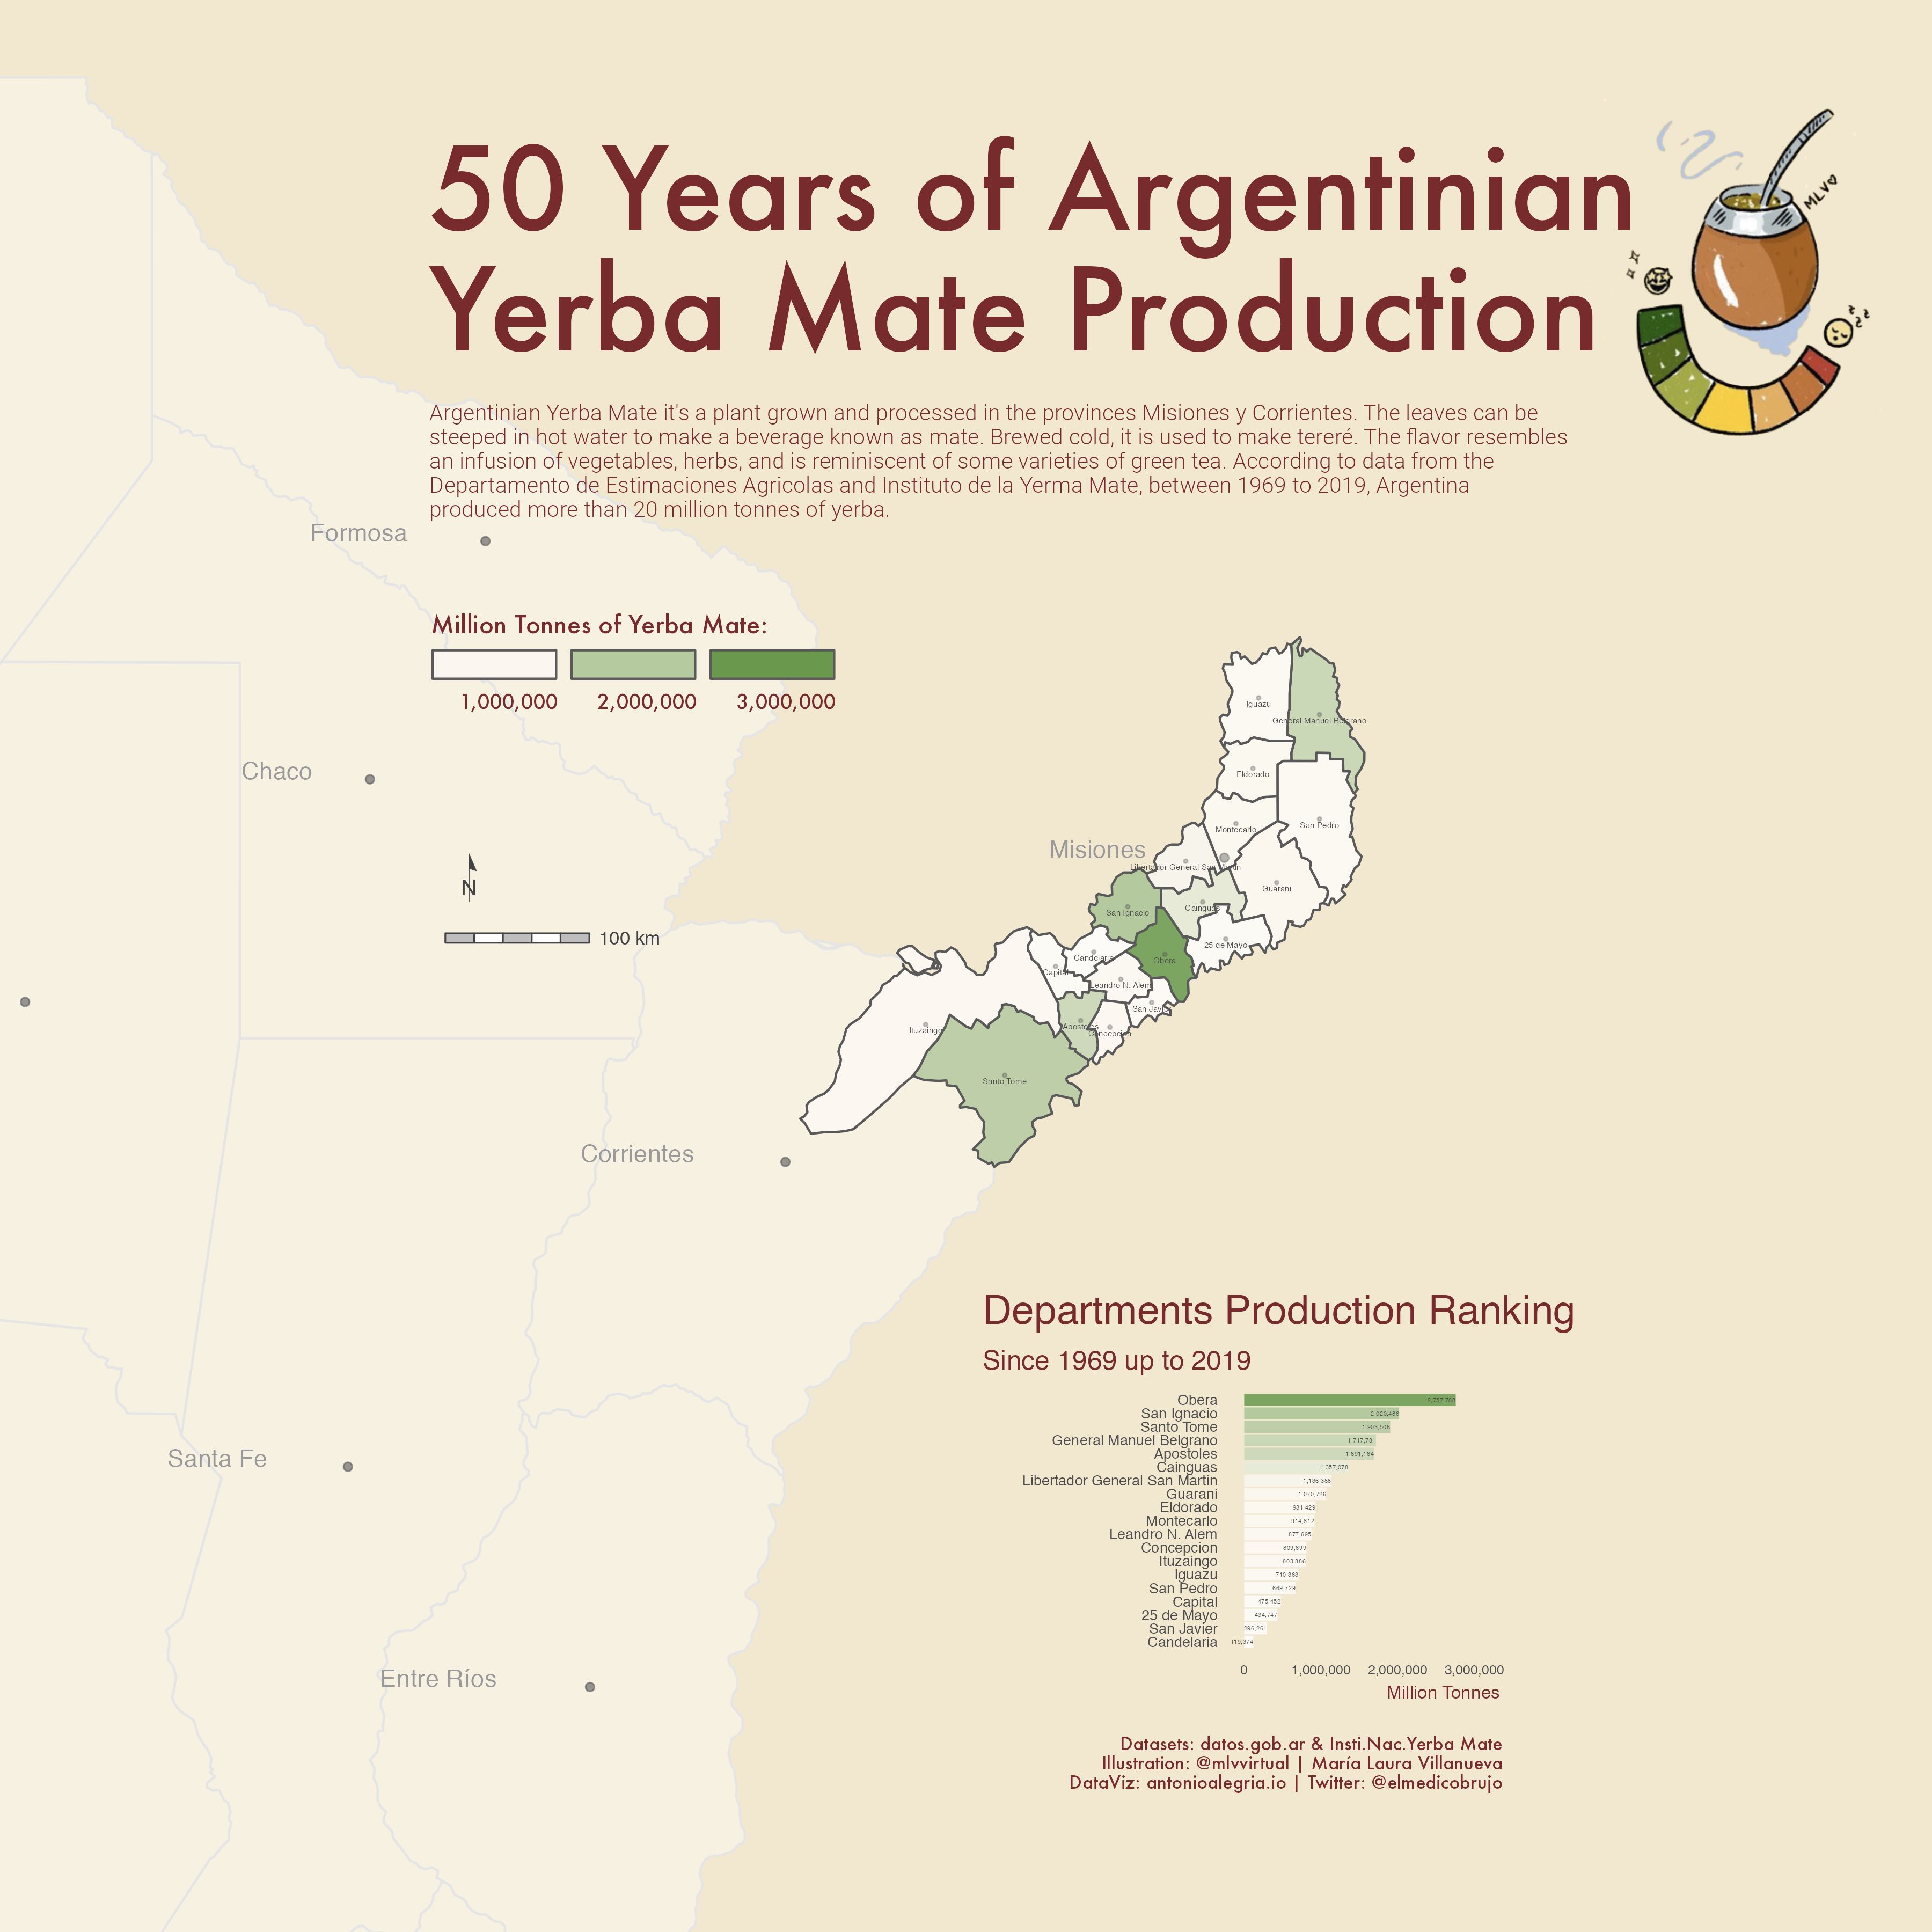
Argentinian Yerba Mate Production
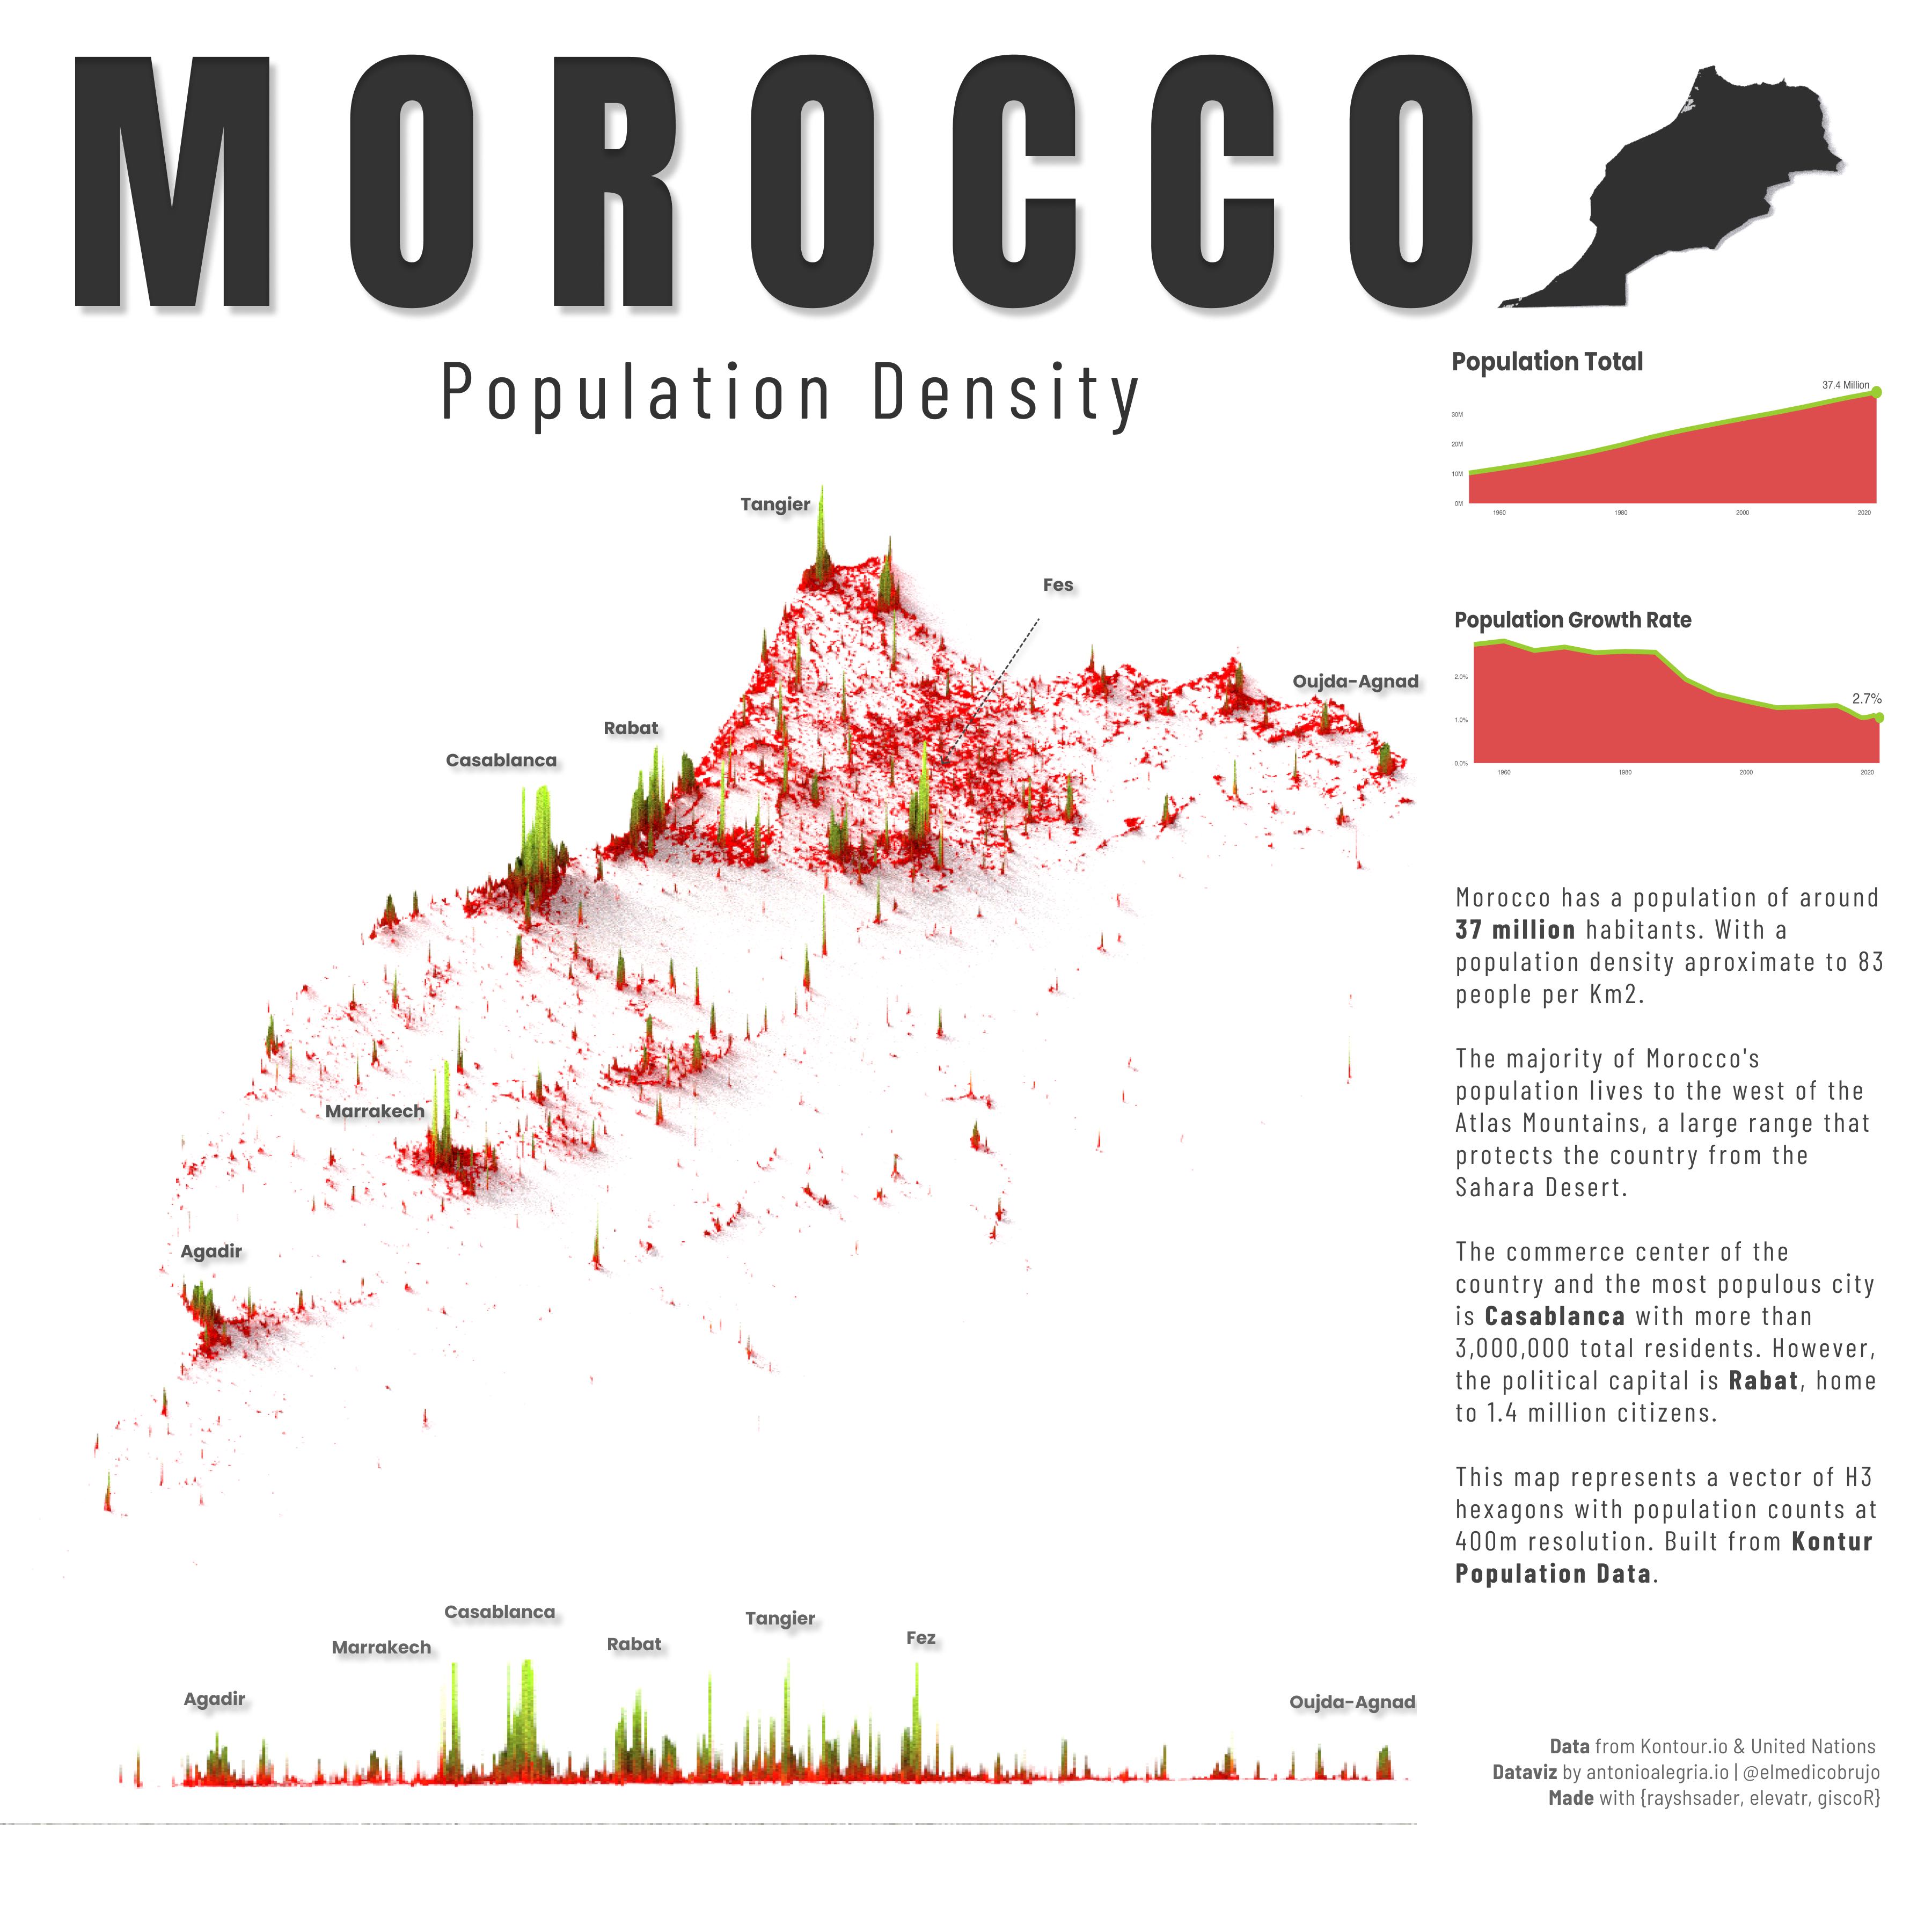
Morocco Population Density
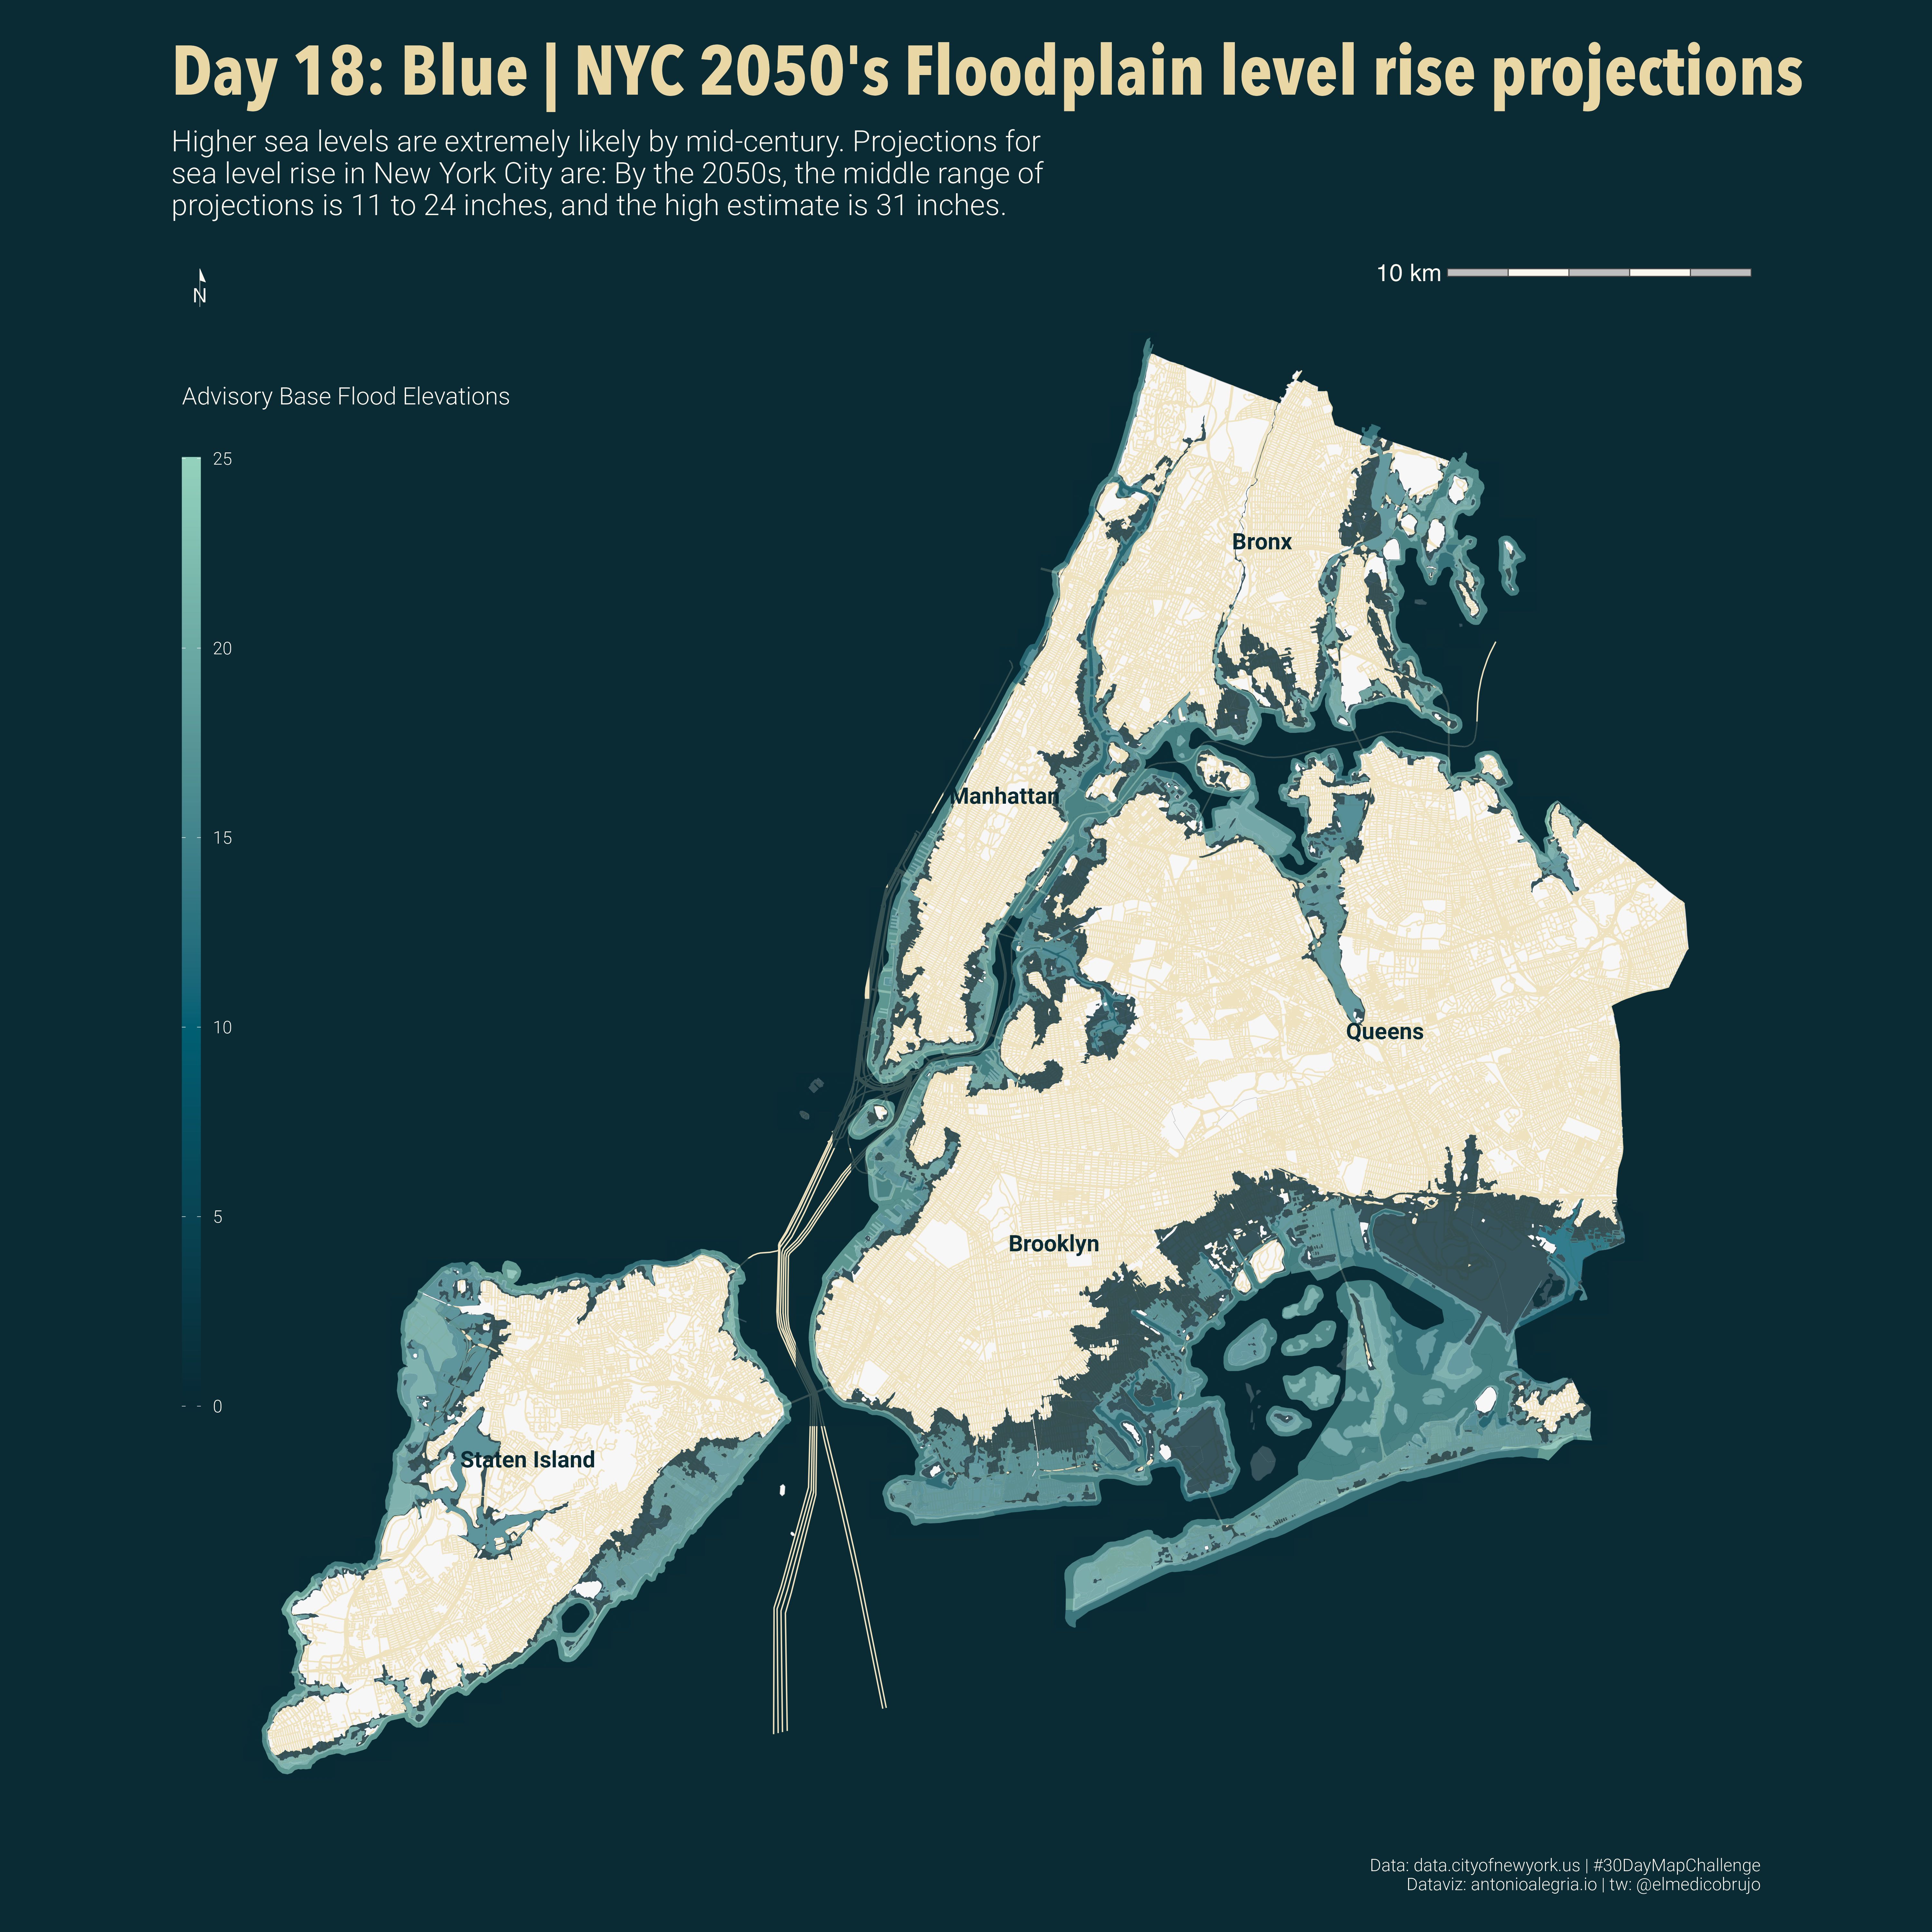
NYC Sea Level Rise